Floki (FLOKI) was the 51st largest crypto at press time in terms of market cap in the global crypto market. It had a market cap of $1.454 billion, as FLOKI price saw a notable surge of 21% this week. In the intraday, its spot volume pumped nearly 100% with an amount standing large at $593.09 Million.
The past 24 hours’ market cap-to-volume ratio signified robust liquidity present at 40.37%. That made it possible for investors to buy and sell FLOKI on the exchange closest to its price value.
Its tokenomics signified that the floating supply has nearly met the total supply. The floating supply was at 9.5 Trillion out of 9.6 Trillion FLOKIs.
Floki Inu Holders | Source: Coincarp
The token’s rich list showed the total holders were at 79.89K, with the top 10 holders amassing the max circulation of 74.23%. The meme-coin has witnessed great adoption and interest in the market.
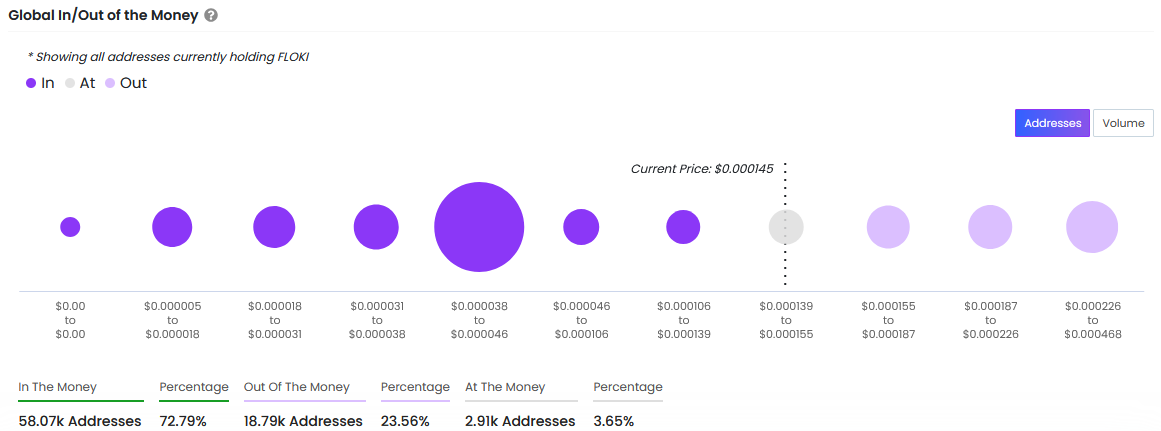
How Many FLOKI Addresses are making money at the current price?
Based on the financial data from the On-chain research website, it was found that nearly 72.79% of addresses were sitting in the money and in profit with having a balance of FLOKI. The 58.07K holders’ addresses were in green from the purchased price.

Financial data | Source: IXFI
Meanwhile, 23.56% were sitting out of money, meaning the total addresses facing significant losses in their holdings were 18.79K addresses. While 3.65% of the addresses were at breakeven prices, making no gain or loss. The number of those addresses was 2.91K.
According to the IntoTheBlock website, the FLOKI token has a 0.85 price correlation with BTC. The number of members in its official Telegram community group has surged this week. The total members have reached 86.27K Members.

Token Summary | Source: Intotheblock
Further, on-chain data exhibits that large investors and whales held 87% of the circulating supply. Similarly, the tokens held on an address for over a 1-year span are 63%, and 32% have held it for 30-365 days.
FLOKI Price Analysis Over the Daily Chart?
The Floki token had an interesting price action on the daily chart in its first quarter. Its price had peaked first at $0.000301, after which it dipped and formed support at $0.000111 demand zone by mid-April 2024.
FLOKI displayed effective bounces from the demand zone, where it blasted off again and created a new all-time high (ATH) of $0.000348 by June 5th, 2024. However, the sell-offs began again after the second week, which led the FLOKI price to dip back to the previous demand zone by the first week of August.
Over a deeper look into its daily chart, the price on August 5th formed a liquidity grab candle and started rising. That showed a more than 50% jump in its price.
In the witnessed surge on the daily chart, this week contributed nearly 20% of gains and pierced the 20-day EMA band. However, the momentum showed struggling signs near the resistance level of $0.000158, with coincided hurdles of dynamic EMA bands of 50-day and 200-day EMA.
The MACD has displayed a bullish crossover with a histogram growing at 0.000004672. The RSI flashed at 57.55, indicating bullishness.
Therefore, if the price continues surging, the next resistance levels are at $0.0002201 and $0.0003012. However, failing to do so would lead to a price decline in FLOKI. Besides, the bears would look at the nearest supports at $0.0001138 and $0.0000919, respectively.


