Toncoin (TON) has dropped by 10% in the last 24 hours, pushing its price below $5 for the first time since May. Currently trading at $4.67, this new low has market participants speculating about the token’s short-term future.
The key question is whether TON will experience a quick recovery or if the recent decline signals further losses ahead.
Toncoin Key Levels to Watch
To analyze Toncoin’s next move, BeInCrypto examines the liquidation heatmap, an indicator that predicts price levels where large-scale liquidation might occur. The heatmap also allows traders to find the best positions where prices might move using the concentration of liquidation levels at that point.
When liquidity levels shift from purple to yellow, it indicates a high concentration of liquidity at that point. This often suggests that the price is likely to move toward that area, as liquidity attracts market activity.
According to Coinglass data, TON’s price could drop to $4.54. If this occurs, over $400,000 worth of contracts are expected to be liquidated
Read more: 10 Best Altcoin Exchanges In 2024
Toncoin Daily Analysis. Source: TradingView
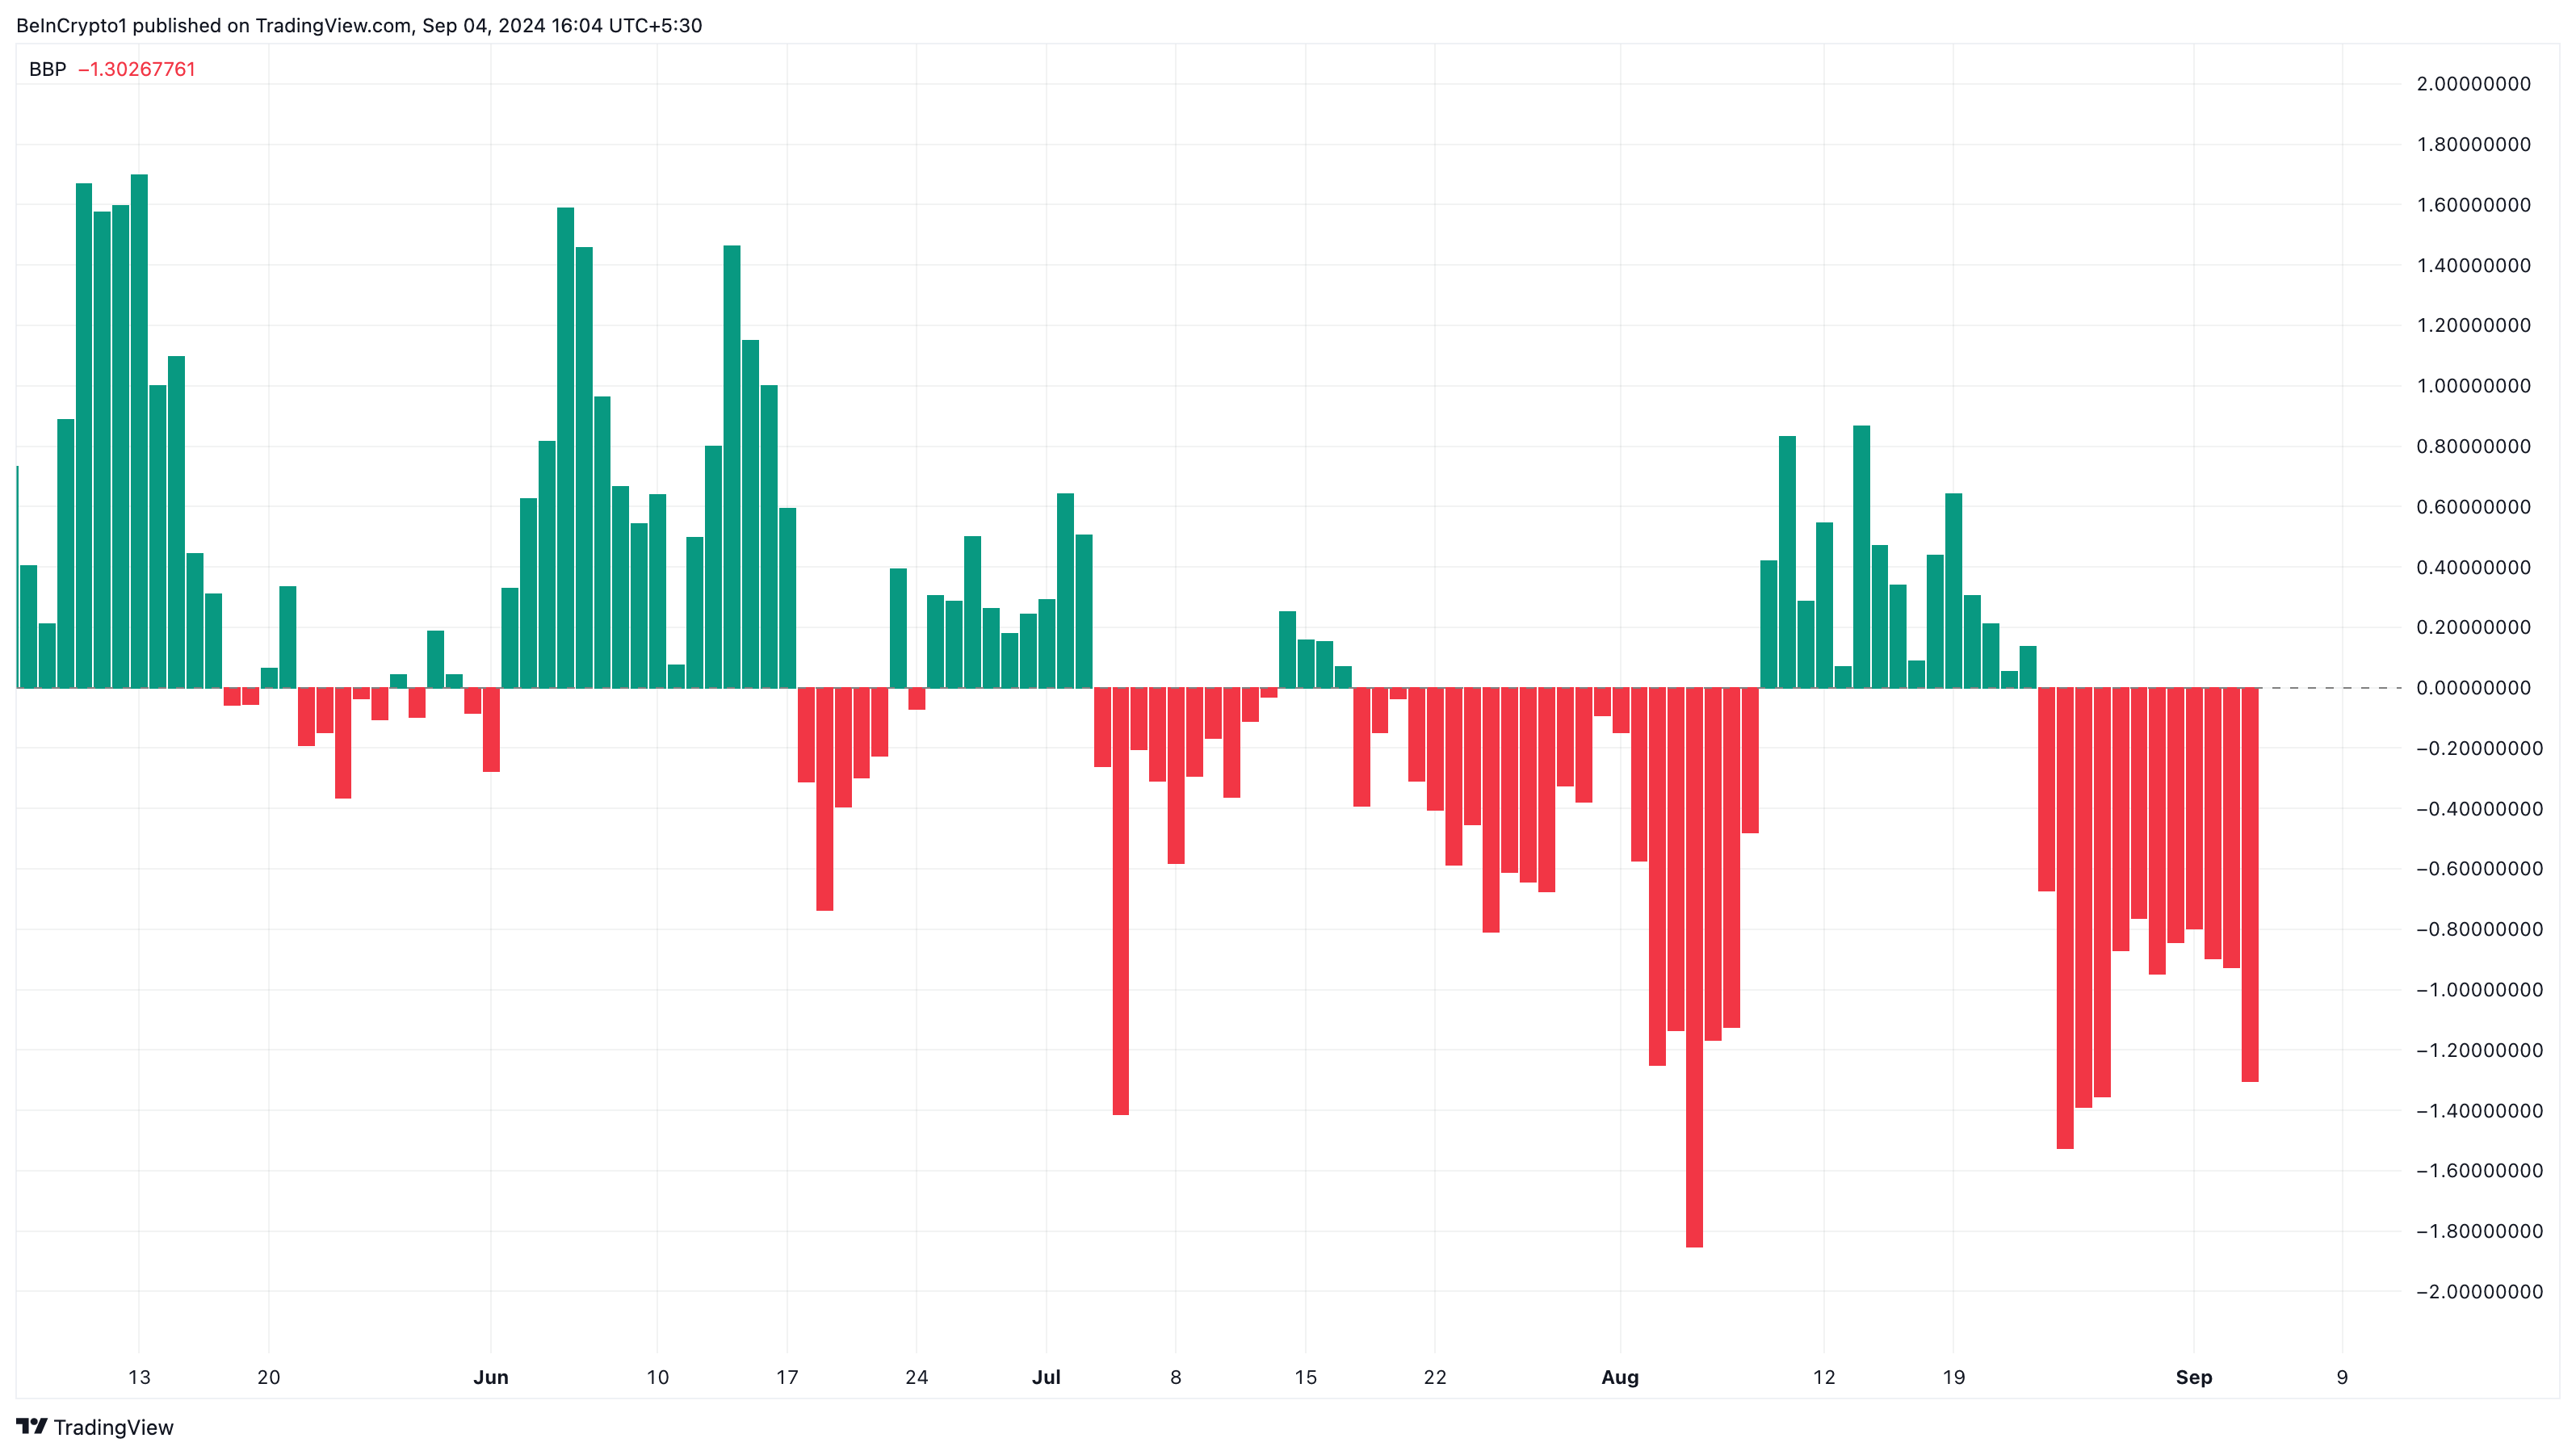
Although there’s another high liquidity area around $4.73, the Bull Bear Power (BBP) indicator suggests this level may not be reached. The BBP is a technical tool used to assess the strength of bulls and bears in the market. When the BBP crosses above the zero line, it indicates that bulls are gaining momentum and prices may rise.
However, in Toncoin’s case, the BBP has crossed below the signal line, signaling that bears currently control the momentum. If this trend persists, TON could face intensified selling pressure, further accelerating the downtrend.

Toncoin Bull Bear Power. Source: TradingView
TON Price Prediction: The Decline Continues
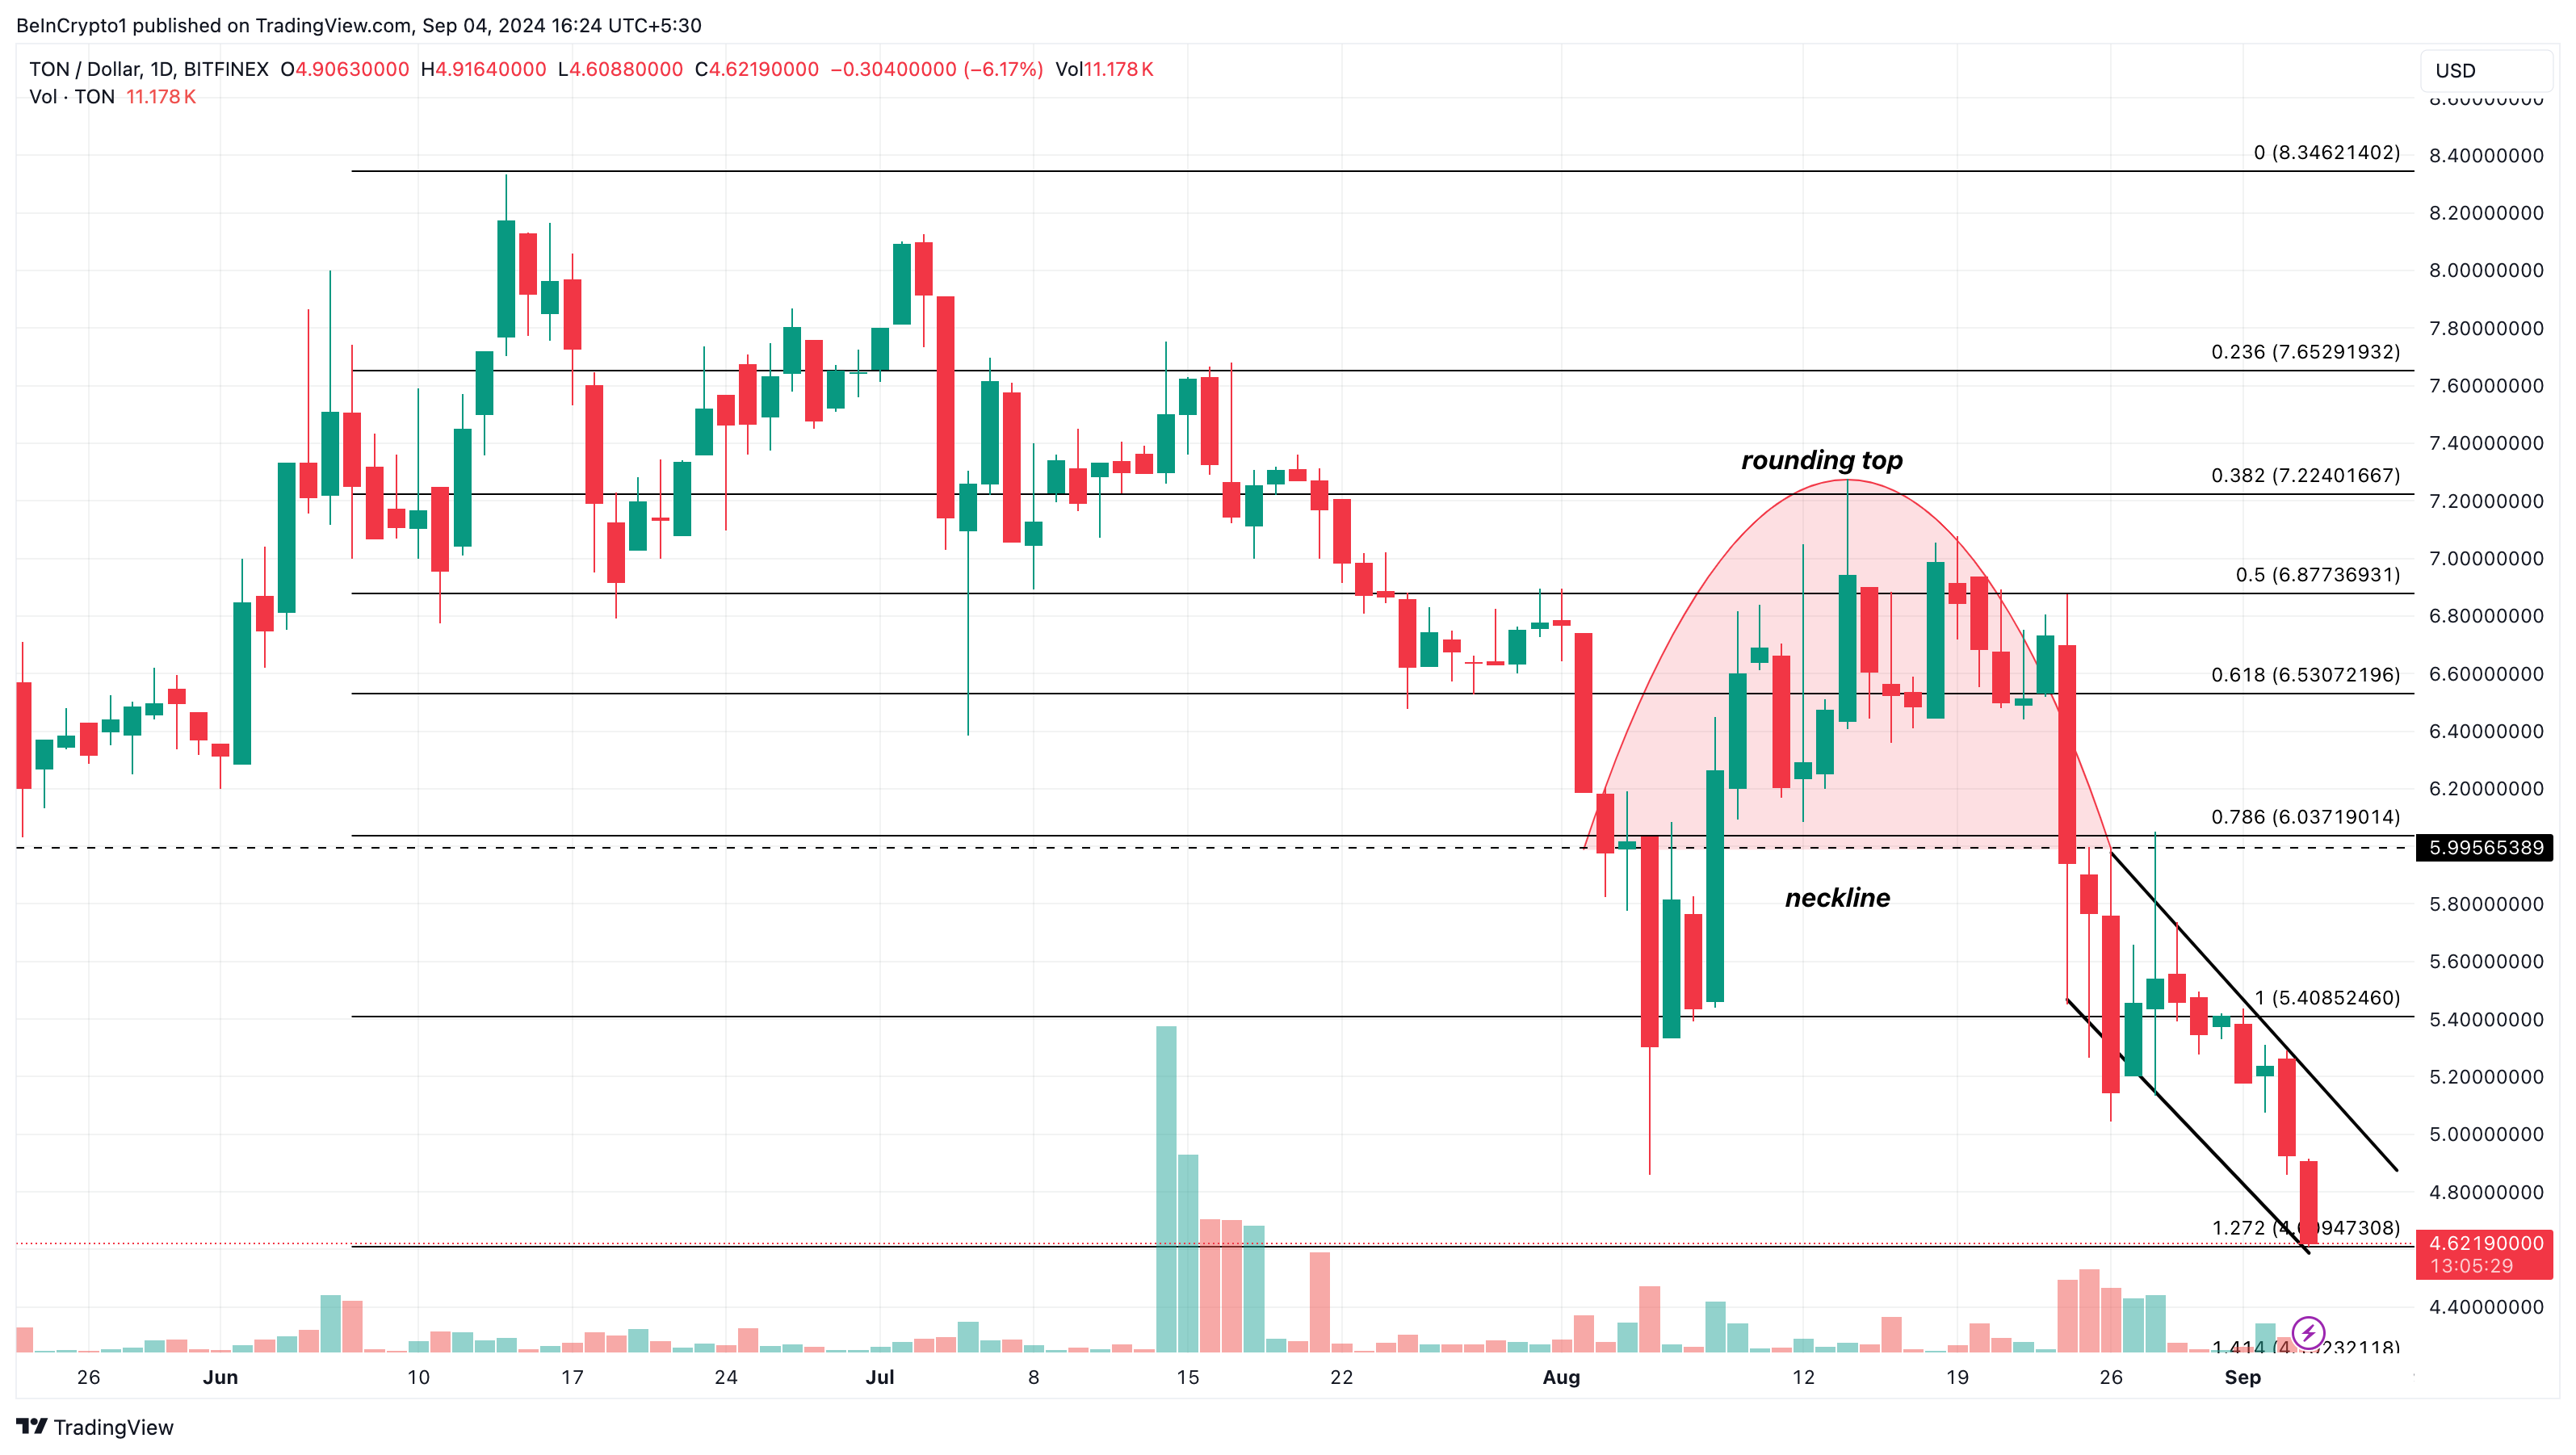
Toncoin price has been trapped in a correctional phase since August 19. This decline implies that the Telegram-backed cryptocurrency has had more periods of distribution than accumulation.
Furthermore, the daily chart shows that TON had formed a rounding top pattern between August 2 and 26. This pattern is typically considered bearish and signals a potential reversal of the previous uptrend.
From the chart below, after the pattern appears, TON had a neckline at $5.99 that could either prevent a drawdown or accelerate it. However, the bulls could not keep the price above the neckline, leading to a slip below $5.
Read more: 6 Best Toncoin (TON) Wallets in 2024

Toncoin Daily Analysis. Source: TradingView
Currently, bulls are not in a position to assist Toncoin in its recovery. As a result, the price could drop below $4.60, potentially reaching $4.55. However, if buying pressure picks up, this downtrend could reverse, allowing TON’s price to rise toward $5.40.


