


XRP’s price has moved erratically, showing a downward trend of late.
The cryptocurrency currently trades at $2.22, down 3.17% over the past 24 hours.
XRP Price Volatility and Selling Pressure
Initially, XRP saw an upward push, reaching a high of $2.30, but it failed to sustain the momentum. The price then fell back and moved between $2.12 and $2.25, indicating stronger selling pressure.
With a 38.52% drop in trading volume, market activity has gone down significantly, suggesting weaker buying interest. If XRP stays above key support levels, a short-term recovery may happen. However, further drops could cause more losses in the coming days.
XRP Price Action: Bearish Outlook
XRP’s recent price action points to a bearish outlook, as the token struggles to regain lost ground. The price initially climbed to $2.30 but met strong resistance, resulting in a sharp decline. It then stabilized within the $2.12 to $2.25 range, showing market uncertainty.
The psychological level of $2.20 played a major role in temporary price stabilization, but buying pressure is still weak.
Source: CoinMarketCap
Key Support and Resistance Levels for XRP
Key resistance levels include $2.30, which acted as the recent peak before the decline, followed by $2.27 and $2.25, where the price attempted recovery but failed.
Related: XRP Price Breakout? Analyst Pinpoints Level for Potential Rally
On the downside, strong support is seen at $2.12, the lowest recorded point in recent trading, with additional support levels at $2.15-$2.18, where temporary stability emerged.
Will XRP Hold $2.20 or Test Lower Levels?
If XRP remains above $2.20, it could make another attempt to break through resistance levels. However, a drop below $2.12 may lead to a test of lower levels, potentially hitting $2.10 or worse.
Bearish Technical Indicators Persist
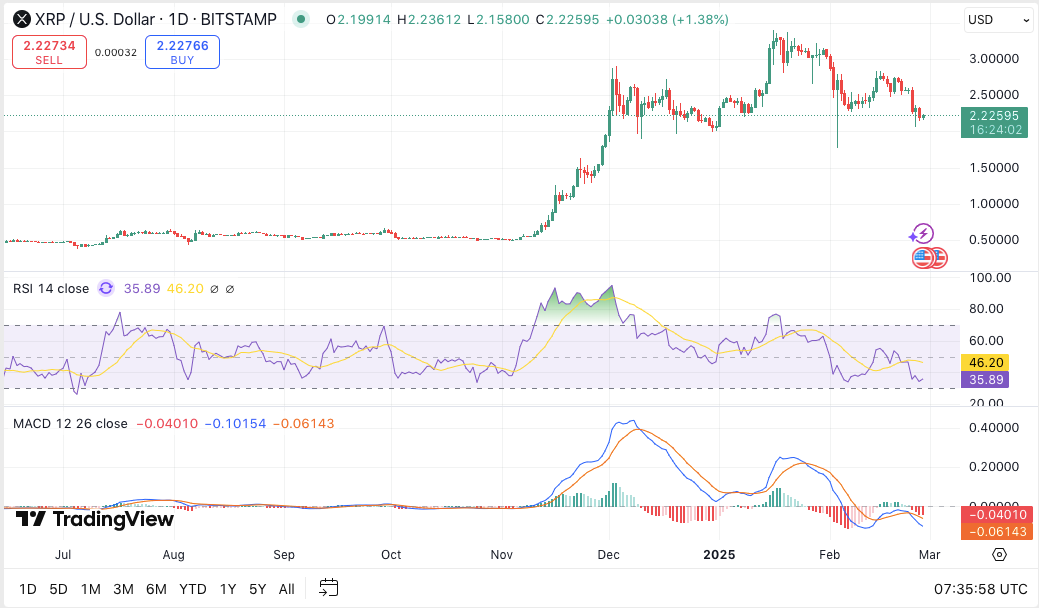
XRP/USD daily price chart, Source: TradingView
Technical indicators confirm this bearish trend, with the RSI currently at 35.68, getting close to oversold territory. This suggests that if buying pressure increases, a potential rebound may occur. However, as long as market sentiment remains weak, recovery chances will be limited.
The MACD line at -0.04036 is below the signal line at -0.06149, confirming bearish momentum. The histogram reflects weak buying activity, signaling continued downside risk unless market conditions shift.
XRP Price Forecast for March 2025: Potential Rebound
Coincodex market projections suggest a potential 5.64% growth in February 2025, bringing XRP’s average price to $2.36.
Related: XRP Weekend Price Alert: Will $3 Resistance Break This Time?
The expected price range for the month is between $2.28 and $2.49, offering a possible return of 11.64% from current levels.
Disclaimer: The information presented in this article is for informational and educational purposes only. The article does not constitute financial advice or advice of any kind. Coin Edition is not responsible for any losses incurred as a result of the utilization of content, products, or services mentioned. Readers are advised to exercise caution before taking any action related to the company.


 Whales on Binance Pushing Price Higher, Data Says")