Shiba Inu (SHIB), the popular meme coin, has shown signs of recovery after a prolonged period of downward pressure, posting a 4% gain in the last 24 hours and holding above a crucial support level of $0.000018 after weeks of downward pressure.
Despite the recent price uptick, Shiba Inu’s 24-hour trading volume has dropped by 25.61% to $449,091,898. This decline in trading volume indicates that investor interest may be tapering off slightly.
SHIB Price Movement
Shiba Inu has maneuvered through a volatile trading environment characterized by swift price swings. According to TradingView, Shiba Inu experienced a short-lived rebound of around the $0.00003 level at the end of last month. However, it faced substantial resistance, resulting in the continuation of the downward trajectory that started from the $0.000045 mark in late Q2.
SHIB/USD 1-Day Chart (Source: Tradingview)
In yesterday’s recovery, Shiba Inu’s price bounced back from a low of $0.000017, a dip that came after three months of bearish trends. This recovery marks an important phase as it stabilizes the coin above the $0.000018 support level, a threshold that previously facilitated a brief recovery in April.
SHIB’s Future Projections
Presently, Shiba Inu is targeting the $0.000021 resistance level. Overcoming this barrier could set the stage for further gains, aiming for higher levels, such as $0.000022, corresponding to the weekly opening price. Such a move could signal a new wave of buying activity in shorter time frames, possibly reigniting bullish sentiment among investors.
However, the overall market conditions remain uncertain. Shiba Inu continues to exhibit a pattern of lower lows and lower highs on the hourly charts, suggesting that the bearish momentum could persist. Should this trend continue, the coin might revisit its February surge levels around $0.000011 before any significant recovery could be sustained.
Key Support and Resistance Levels
As Shiba Inu navigates through this volatile period, several vital levels have emerged as critical markers for its short-term trajectory. The immediate support after the recent gain is found at $0.000017. Should the price fall, additional levels of support are likely at $0.000011 and $0.00000769, which are essential for cushioning further declines and providing rebound opportunities.
On the upside, breaking above the $0.000021 mark could pave the way for Shiba Inu to challenge the $0.000026 and $0.00003 resistance levels. A successful flip of these levels could lead the coin towards higher resistances at $0.000033 and $0.000039, setting new targets for bullish traders.
SHIB Technical Indicators
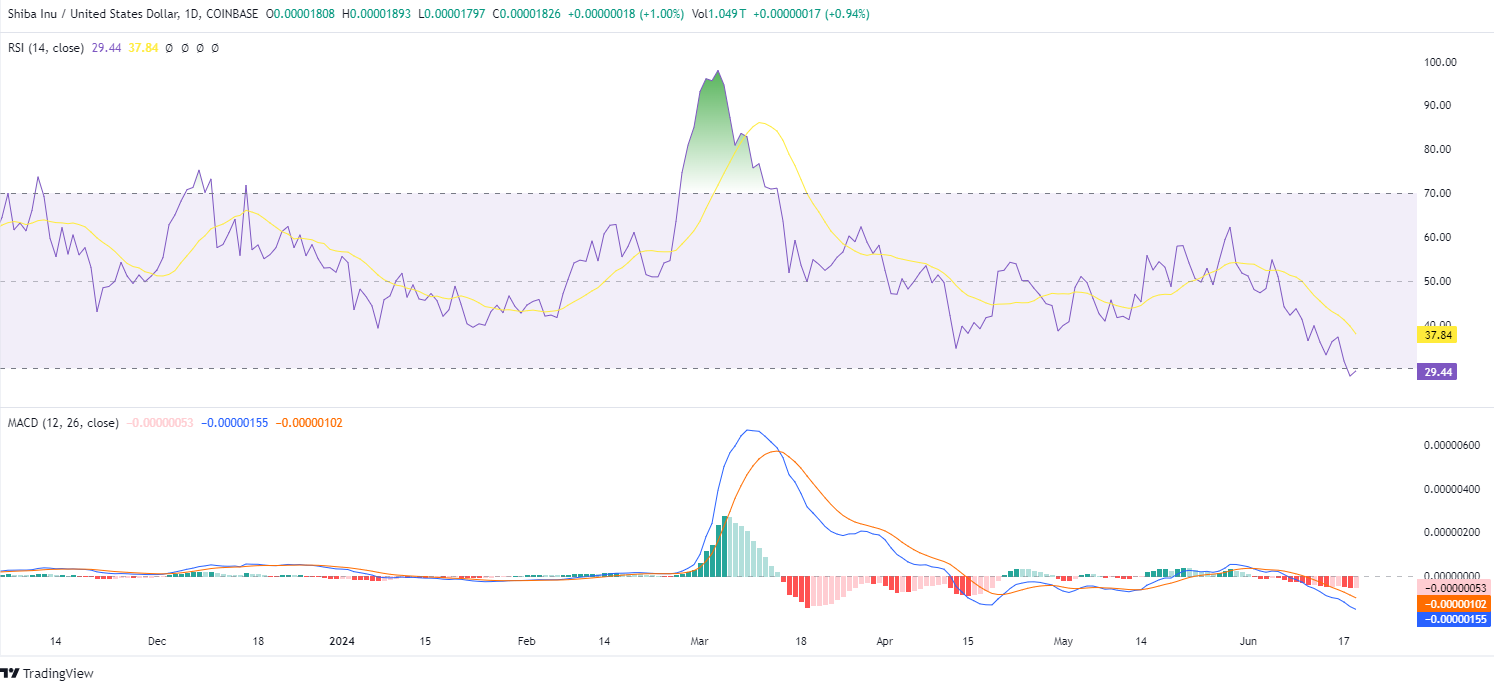
Technically, the RSI indicator is currently in the oversold region at 29.44. This suggests that the market could be poised for a reversal or a bounce-back soon, as selling pressure may start to wane. If the support level at $0.000018 holds, the RSI could signal a bullish trend reversal.

SHIB/USD 1-Day Chart (Source: Tradingview)
Conversely, the MACD indicator is below the zero line at 0.0000015, implying that SHIB may continue to experience downward momentum in the short term. This is further supported by the histogram showing a series of widening red bars, which suggests a bearish trend.
However, traders should keep an eye on both indicators to identify optimal buy and sell signals.
Disclaimer: The information presented in this article is for informational and educational purposes only. The article does not constitute financial advice or advice of any kind. Coin Edition is not responsible for any losses incurred as a result of the utilization of content, products, or services mentioned. Readers are advised to exercise caution before taking any action related to the company.


