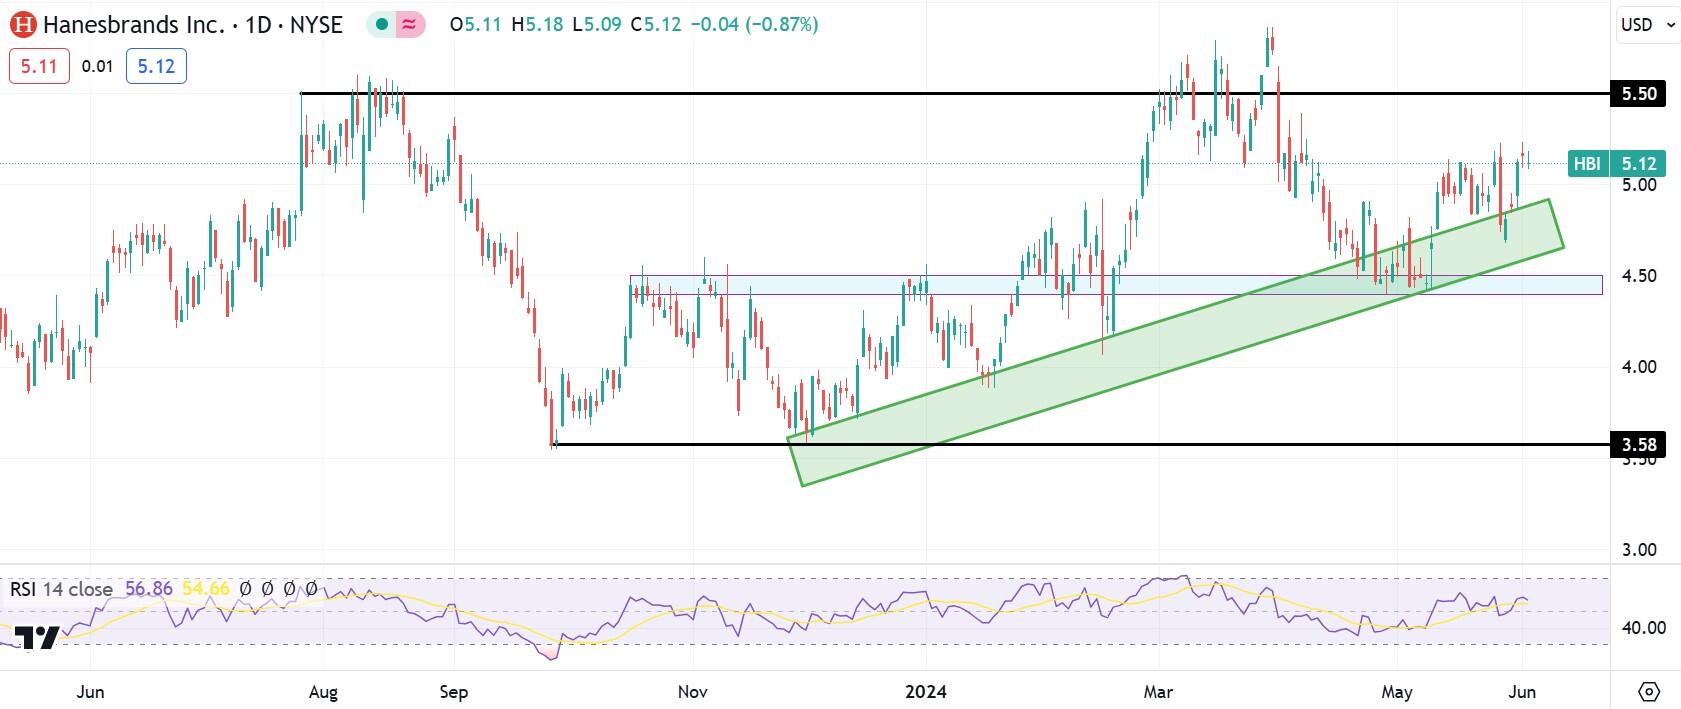
- Hanesbrands stock has recently made a new range high.
- HBI stock has been trending downward for most of the last nine years.
- Dow Jones, S&P 500, NASDAQ gain in the afternoon on Tuesday.
- Authentic Brands still in talks to purchase Champion from Hanesbrands.
Hanesbrands (HBI) stock has been showing signs of life lately after experiencing a long-term downtrend that has lasted the better part of nine years. However, share price gains in March placed HBI stock in a technical short-term uptrend as it reached its first range high coupled with higher lows in years.
The S&P 500, NASDAQ and Dow Jones have all produced light gains on Tuesday afternoon after selling off earlier in the session. HBI, however, declined 2.1% to $5.05.
Hanesbrands stock news
Shareholders are still awaiting further news regarding Hanesbrands’ sale of the Champion brand to Authentic Brands. Not much has changed since late May when it was said that the negotiations continue to stall between $1 billion and $1.4 billion.
Champion owns production equipment that is rather costly to run, so Authentic Brands wants to pay a flat $1 billion for the brand and its assets since some of these operations will need to be shut down in favor of moving production overseas.
Citigroup analyst Paul Lejuez called the $1 billion offer a “distressed sale” but said that Hanesbrands would not bear much tax liability due to loss carryforwards.
When the acquisition was announced in early April, HBI stock fell 10% as traders thought the deal was unattractive for the seller. Now, however, negotiations are expected to last through September as Hanesbrands management holds out for better details.
Lejuez thinks that the sale would allow Hanesbrands to pay down debt and emerge with earnings of $0.67 per share in 2024 profit.
Penny stocks FAQs
Originally, penny stocks were any stock that traded for less than $1, i.e. pennies. The Securities & Exchange Commission has since altered the definition to include any stock that trades for less than $5. Penny stocks are typically associated with small companies that have either experienced poor results, sending their share price down, or with companies who dilute their share price by issuing lots of shares over time in order to fund operations or acquisitions.
Some penny stocks trade on respected exchanges, such as the NASDAQ or the NYSE. Examples of these are Mullen Automotive (MULN) and Bark (BARK). Those exchanges have requirements though. For the NYSE, listed stocks must have 1.1 million publicly traded shares outstanding with a market value of at least $40 million. The NASDAQ requires a share price minimum of $4, a minimum of 1.25 million shares and a market cap of $45 million. Most penny stocks, however, trade on the OTC (over-the-counter) market. This may mean the OTC Bulletin Board or the privately-owned OTC Markets Group.
Quite often the sharpest movers on any normal trading day are found among penny stocks. This is because non-penny stocks tend to have more liquidity, and the market is more certain about larger companies’ long-term values. Penny stocks are illiquid, meaning there is little supply available if an announcement drives more buying demand into a particular stock. There are no market makers that hold large amounts of penny stocks just to dispense them at a slightly higher price point. Additionally, most of these penny stocks suffer from a news desert where few market players know anything relevant about them. This is why a small biopharma company can issue news about a successful drug trial and immediately rocket 500% higher, with no analysts on Wall Street covering it.
Typically, the answer is “No”. Penny stocks are more risky than higher-priced stocks on average. Penny stock investors have a higher chance of losing their capital by investing in weaker companies. There is a reason why they are penny stocks in the first place, which is that largely the mainstream market is not interested in investing in them. Two groups of investors tend to focus on penny stocks, however. The first group are day traders, who know that the lack of liquidity in penny stocks could lead to extremely large swings over a short time period. The other group is made up of investors who like the fact that these stocks are disregarded. This allows these investors to gain an advantage by benefiting from upcoming announcements, because the larger market is not paying attention.
Hanesbrands stock forecast
The long-term trend for Hanesbrands stock has been downward for quite some time. Since mid-2023 though, HBI stock has been consolidating and moving sideways in the $4.00 to $5.00 range. If the present rising share price can continue making gains, the $8.00 level from January 2023 and the $11.50 resistance level from summer 2022 both offer possible bull targets.
HBI weekly stock chart
The daily chart below shows that there was a double bottom near $3.58 in late 2023, which appears to have put in a true bottom for HBI. Since then the textile company has lifted itself past the prior range high near $5.50 to a new one-year high of $5.86. Though the share price moved back down to the vicinity of $4.50 earlier this year, HBI quickly found support there before catapulting back above $5.00.
The green rectangle shows that higher lows continue to push the share price upward since last November. If the share price moves back above $5.86, expect the market to pounce on the beaten down stock and keep it bid. The Relative Strength Index (RSI) between 50 and 70 shows that shares are not overbought but are gaining momentum.
HBI daily stock chart


![Adani Enterprises – ADANIENT Elliott Wave technical analysis [Video]](https://i1.wp.com/editorial.fxsstatic.com/images/i/supermicro-02_Large.jpg?w=1024&resize=1024,1024&ssl=1)


