Bears have remained dormant in today’s session as evidenced by the dropping global market cap which has dropped by 2.3% over the last 24 hours to $2.64 trillion while the trading volume dropped by 6.9% within the same period to stand at $105.4B.
Bitcoin Price Review
Bitcoin (BTC) has now fallen below $69K as the crypto king continues consolidating. The price has been in a downtrend recently, below the middle Bollinger Band (the 20-period SMA) indicating that bears control the Bitcoin price.
The Relative Strength Index (RSI) is around 54, indicating neither overbought nor oversold conditions. The Bitcoin price stood at $69,176 as of press time representing a 0.99% drop from its previous 24-hour price.
2-hour BTC/USD Chart | Source: TradingView
Ethereum Price Review
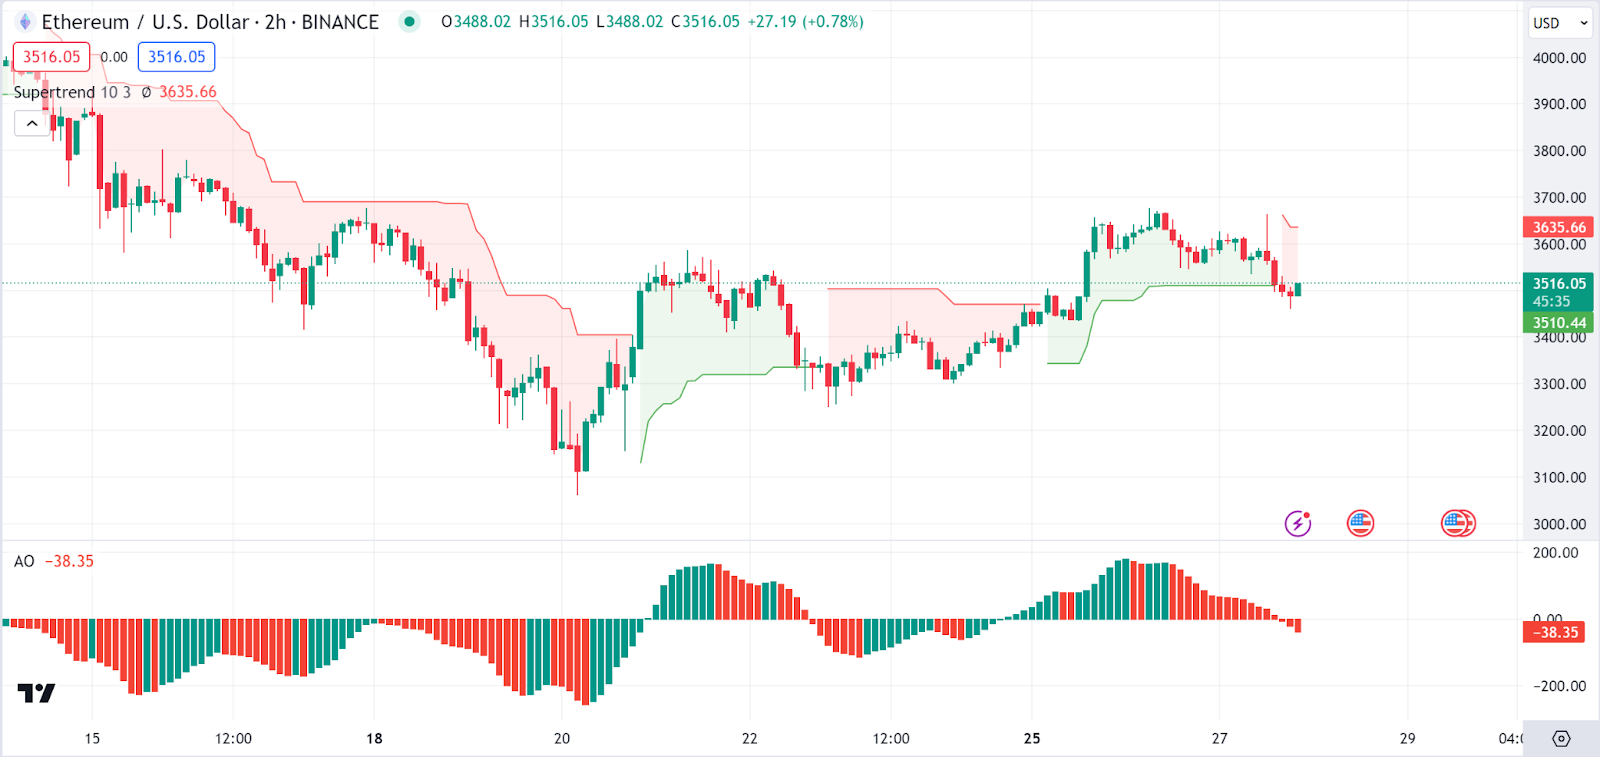
Ethereum (ETH) is also facing a consolidation period as the token failed to post gains in today’s session. Analysing charts, the SuperTrend signals bearishness as the Ethereum price is below the SuperTrend line.
The Awesome Oscillator (AO) decreases below zero, suggesting bearish momentum. However, the Ethereum price seems to be consolidating after a bearish trend, indicating that traders might wait for a clearer signal from the SuperTrend or a shift in the AO for potential entry points. The Ethereum price stood at $3,580 as of press time representing a 2.5% dump over the last 24 hours.

2-hour ETH/USD Chart | Source: TradingView
Bonk Price Review
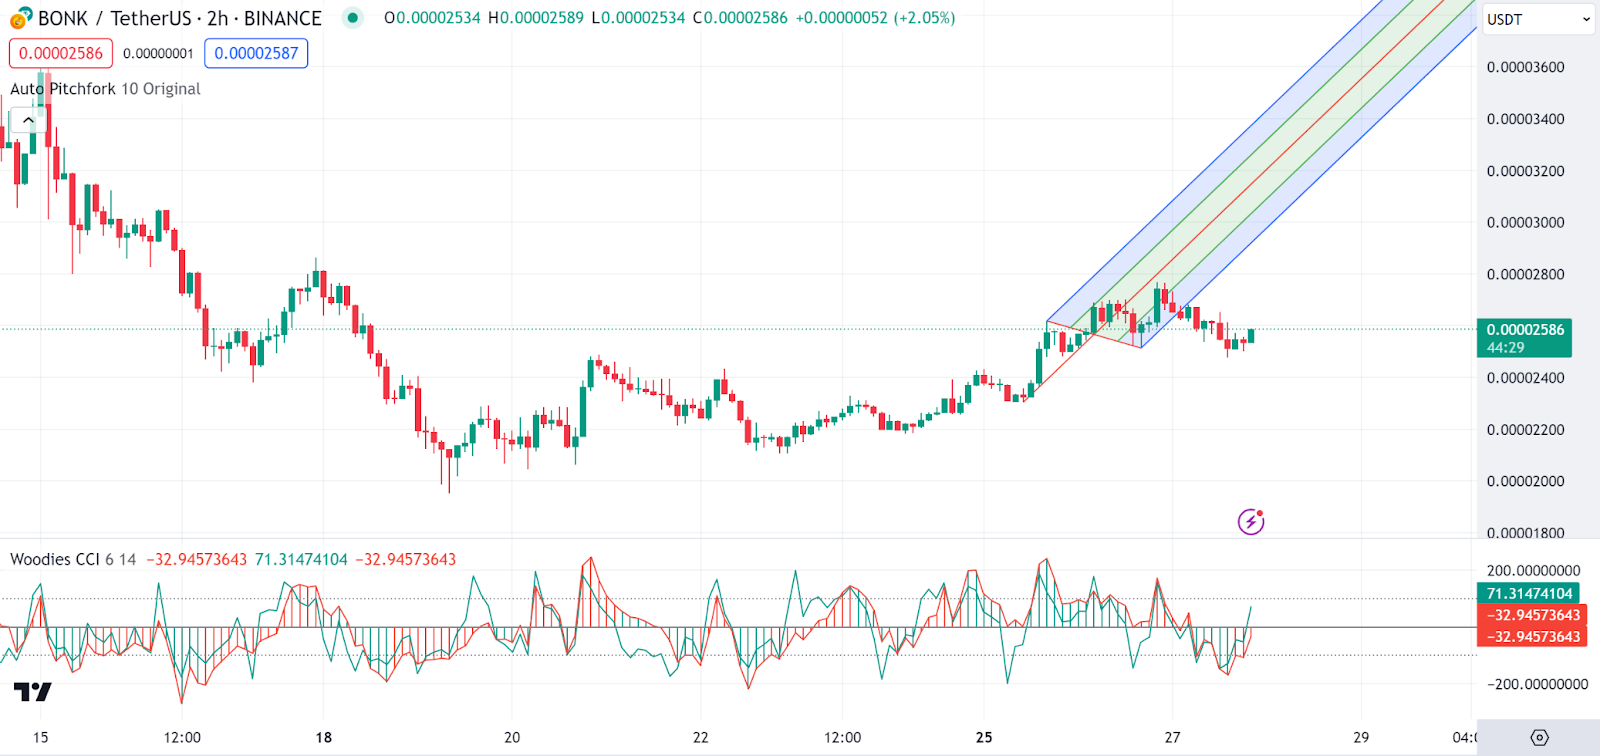
Bonk has also failed to post gains in today’s session as the emme coin corrects from its recent pumps. The Bonk price is within the lower half of the Pitchfork, which may suggest bearish sentiment on the Bonk price’s future trajectory.
The Woodie’s CCI fluctuates around the zero line, indicating a lack of strong momentum in either direction. The Bonk price stood at $0.00002598 as of press time representing a 3.4% dump over the last 24 hours.

2-hour BONK/USDT Chart | Source: TradingView
Aptos Price Review
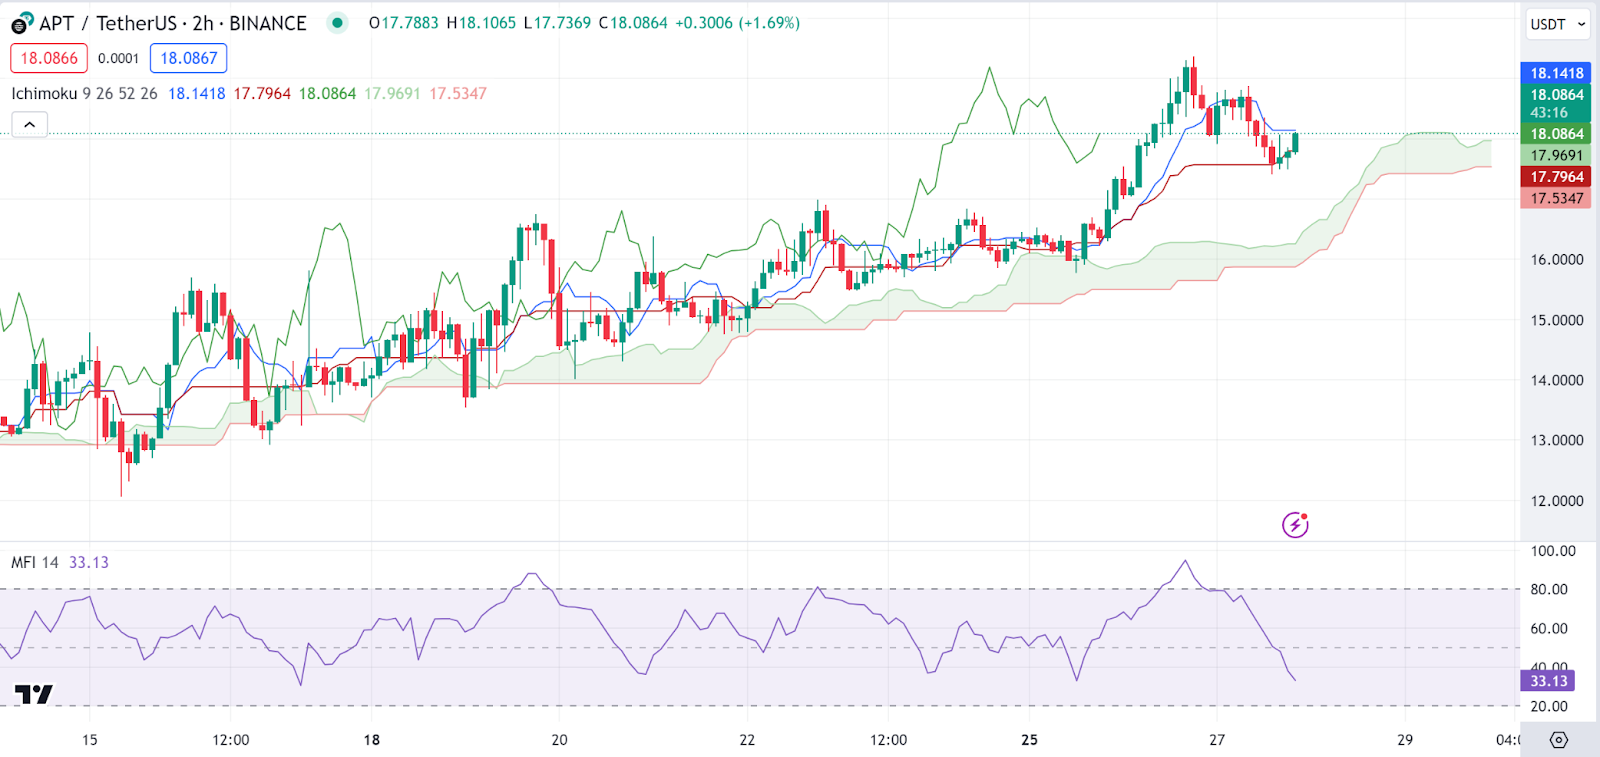
Aptos has also fallen prey to today’s consolidation phase as seen from its minor corrections. The Aptos price is between the Ichimoku Cloud boundaries, indicating a potential trendless state or consolidation.
On the flip side, the Money Flow Index (MFI) is just above 33, suggesting that the market is not in an extreme condition. The Aptos price stood at $18.07 as of press time representing a 2.8% price drop from its previous 24-hour one.

2-hour APT/USDT Chart | Source: TradingView
Sui Price Review
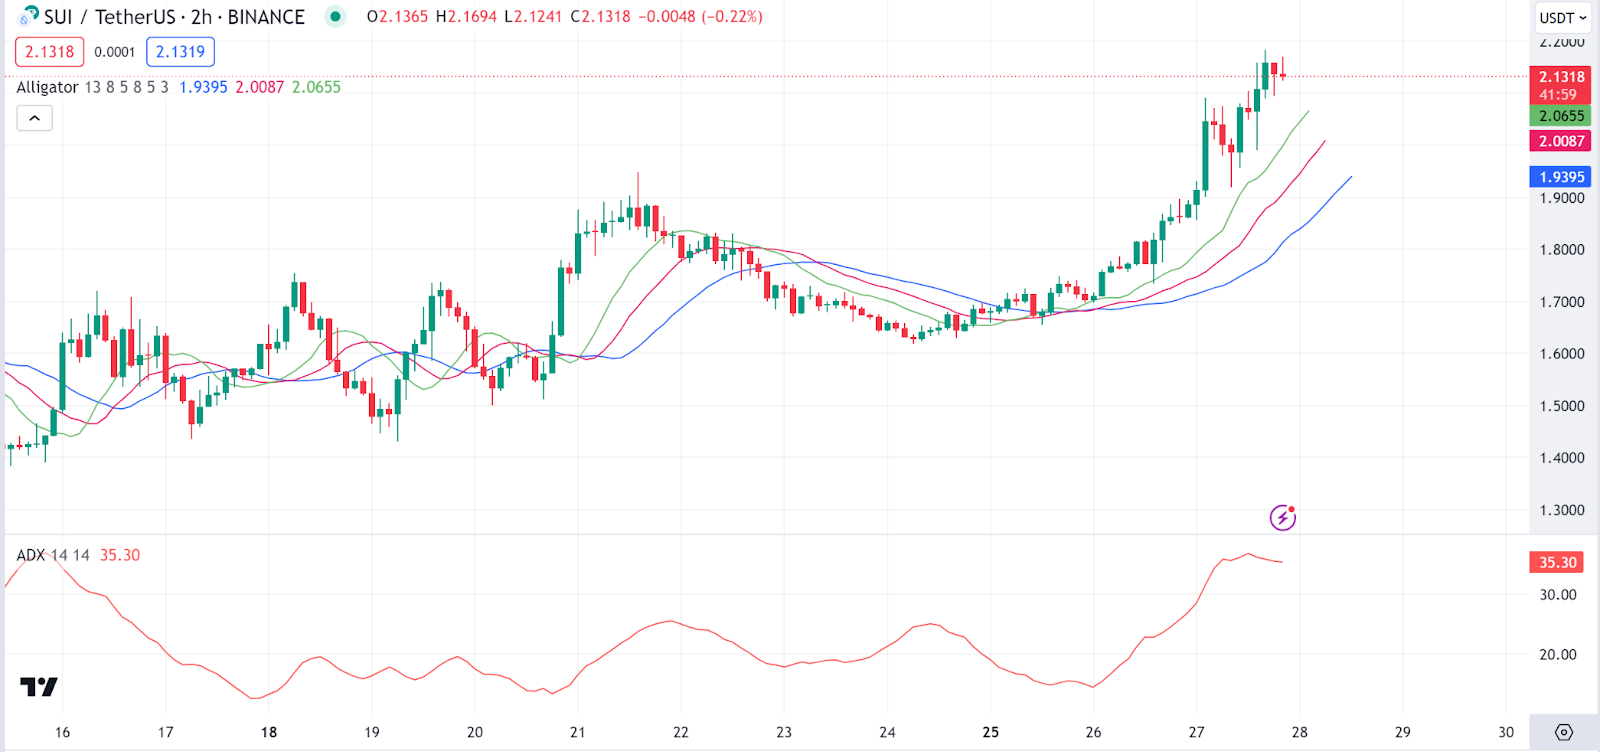
However, despite today’s consolidations, Sui (SUI) has managed to post some gains. The Alligator’s lines are intertwined, which usually indicates a lack of a clear trend or a consolidation period on the Sui price.
The Average Directional Index (ADX) is relatively high at 35, which indicates a strong trend. The Sui price stood at $2.11 as of press time, representing a 13.5% price pump compared to its previous 24-hour pump.

2-hour SUI/USDT Chart | Source: TradingView


