XRP is currently trading at $3.12, with a market capitalization of $179 billion, a 24-hour trading volume of $3.29 billion, and an intraday price range of $3.08 to $3.14, indicating critical levels for traders to monitor.
XRP
XRP’s 1-hour chart reveals a consolidation phase as the crypto asset trades in a narrow range between $3.10 and $3.20. The lack of higher highs or lower lows underscores weak momentum, while subdued volume reflects limited market participation. Traders should watch for a breakout above $3.15 to $3.20, supported by increasing volume, to confirm a bullish move targeting $3.25 to $3.30. Conversely, a breakdown below $3.10 could lead to further downside risk.
XRP/USDT 1H chart on Jan. 25, 2025.
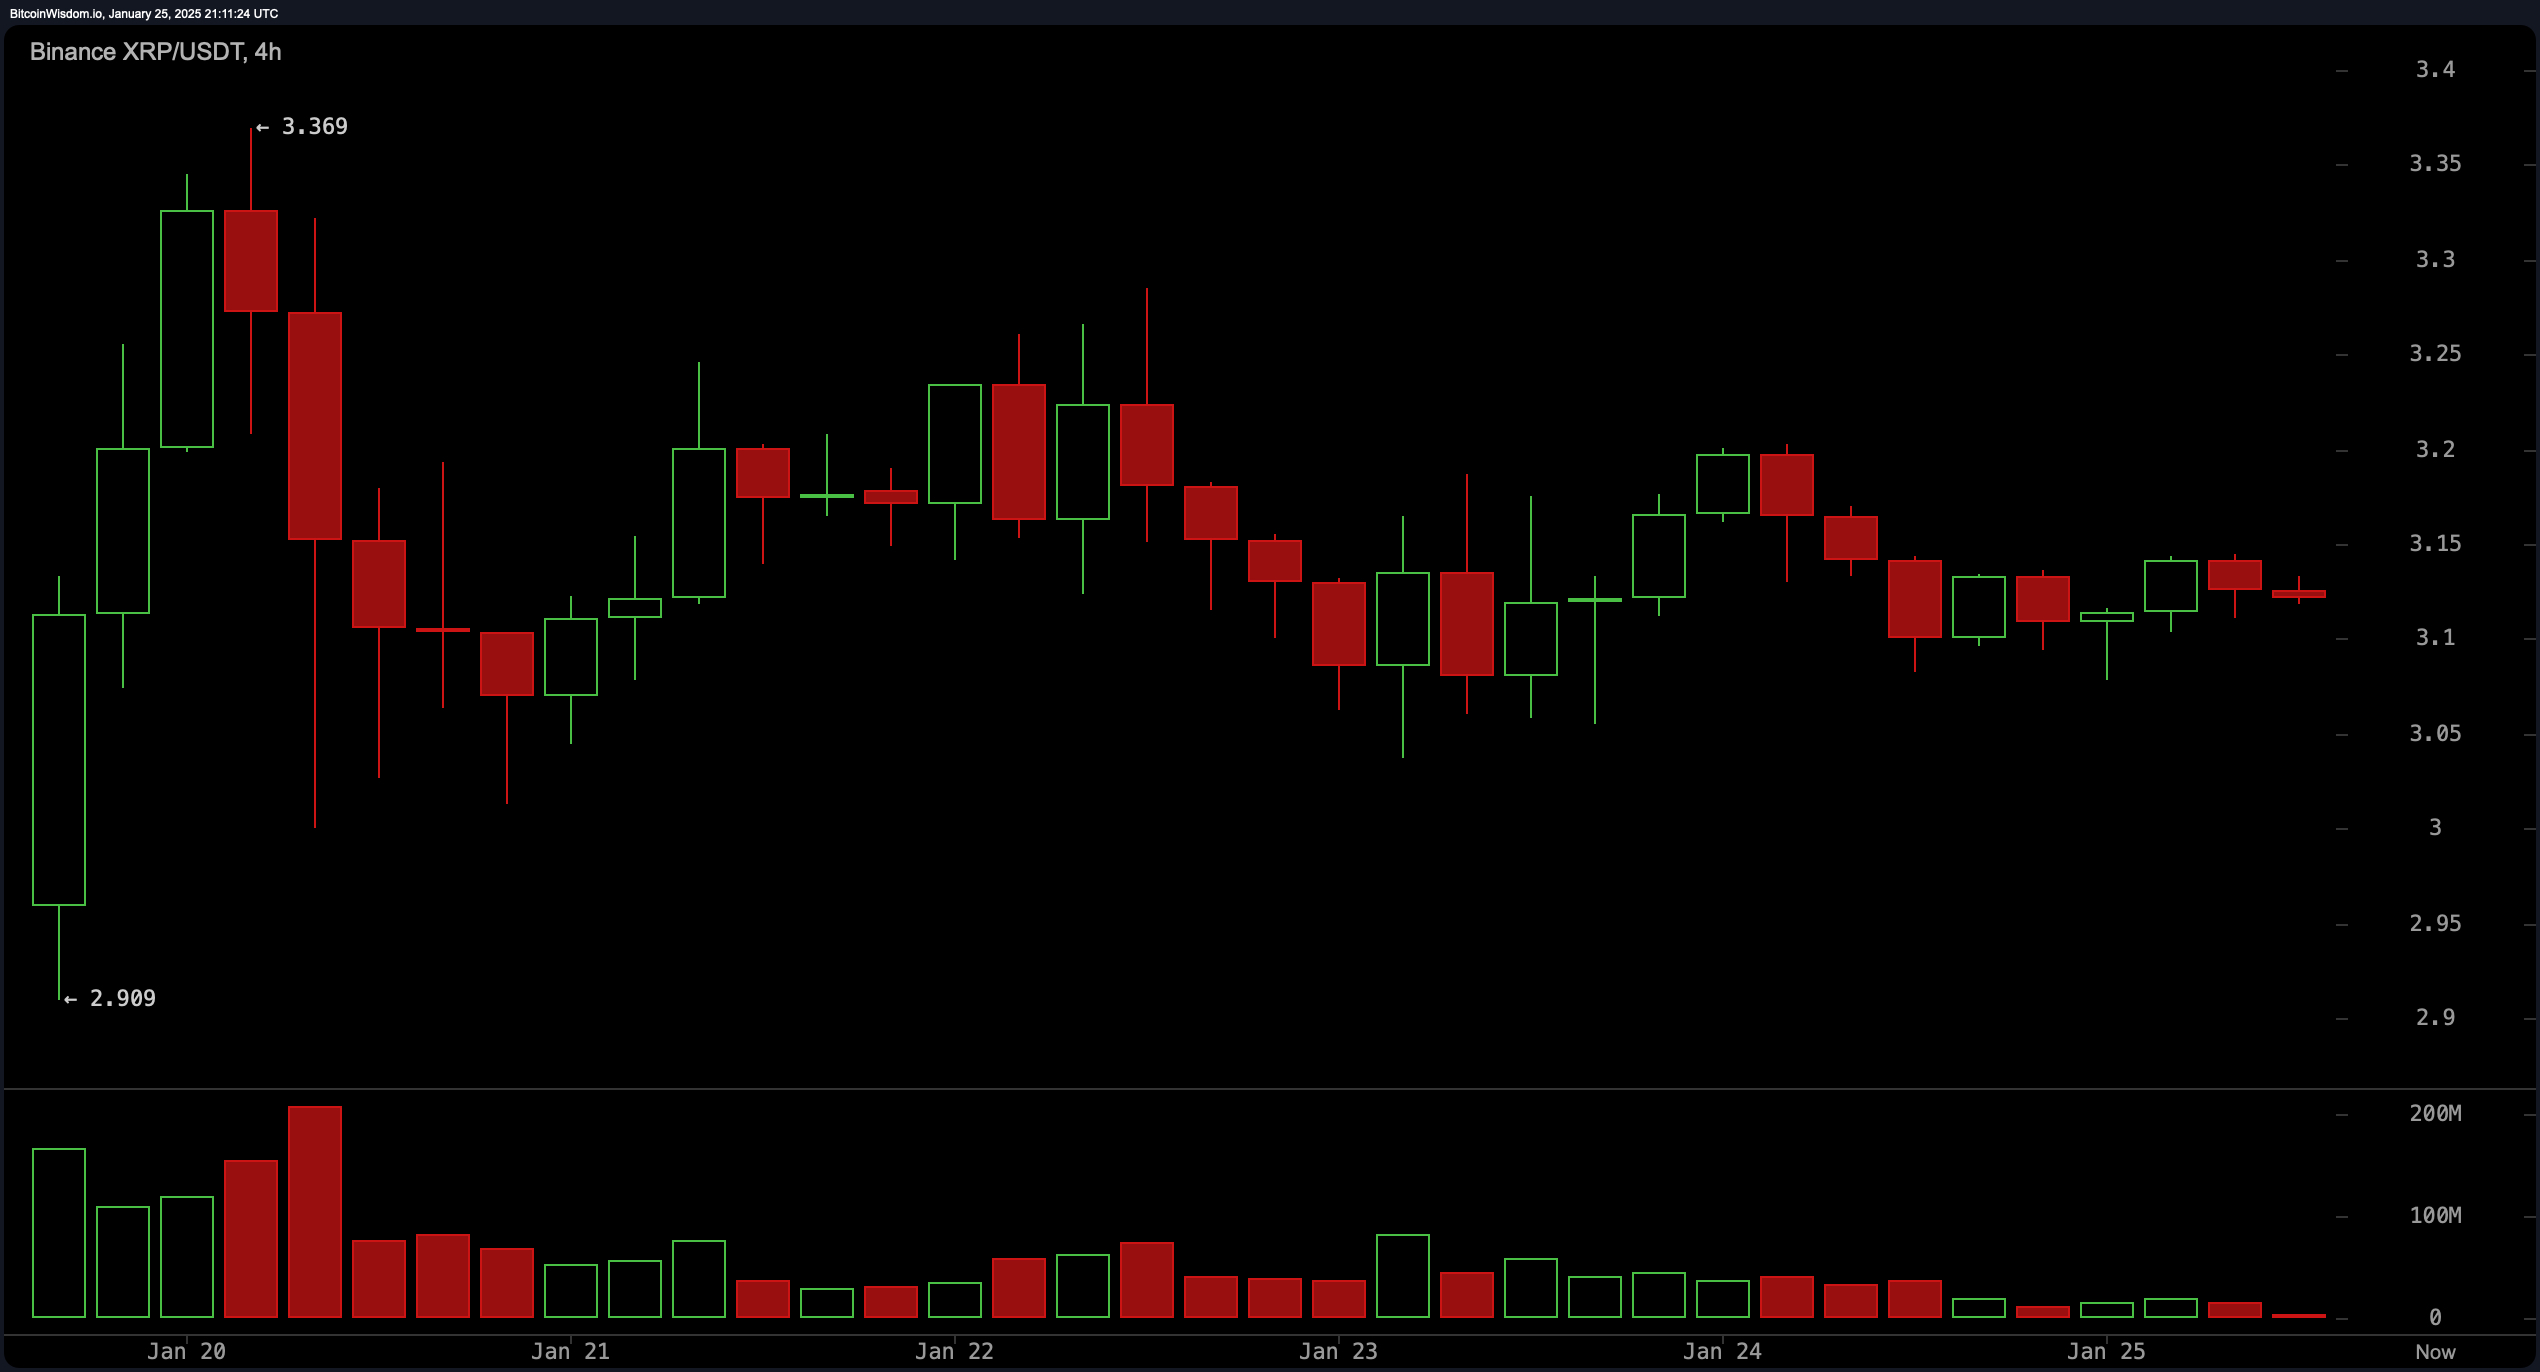
The 4-hour chart shows a short-term downtrend after testing resistance at $3.40, with XRP forming lower highs. Support at $3.10 has held firm, while resistance at $3.20 remains unbroken. Decreasing volume on the retracement suggests fading selling pressure, hinting at a potential base near $3.10. A sustained breakout above $3.20 with rising volume would signal a recovery, whereas a breach of $3.10 could push prices toward the lower end of the range at $3.00.

XRP/USDT 4H chart on Jan. 25, 2025.
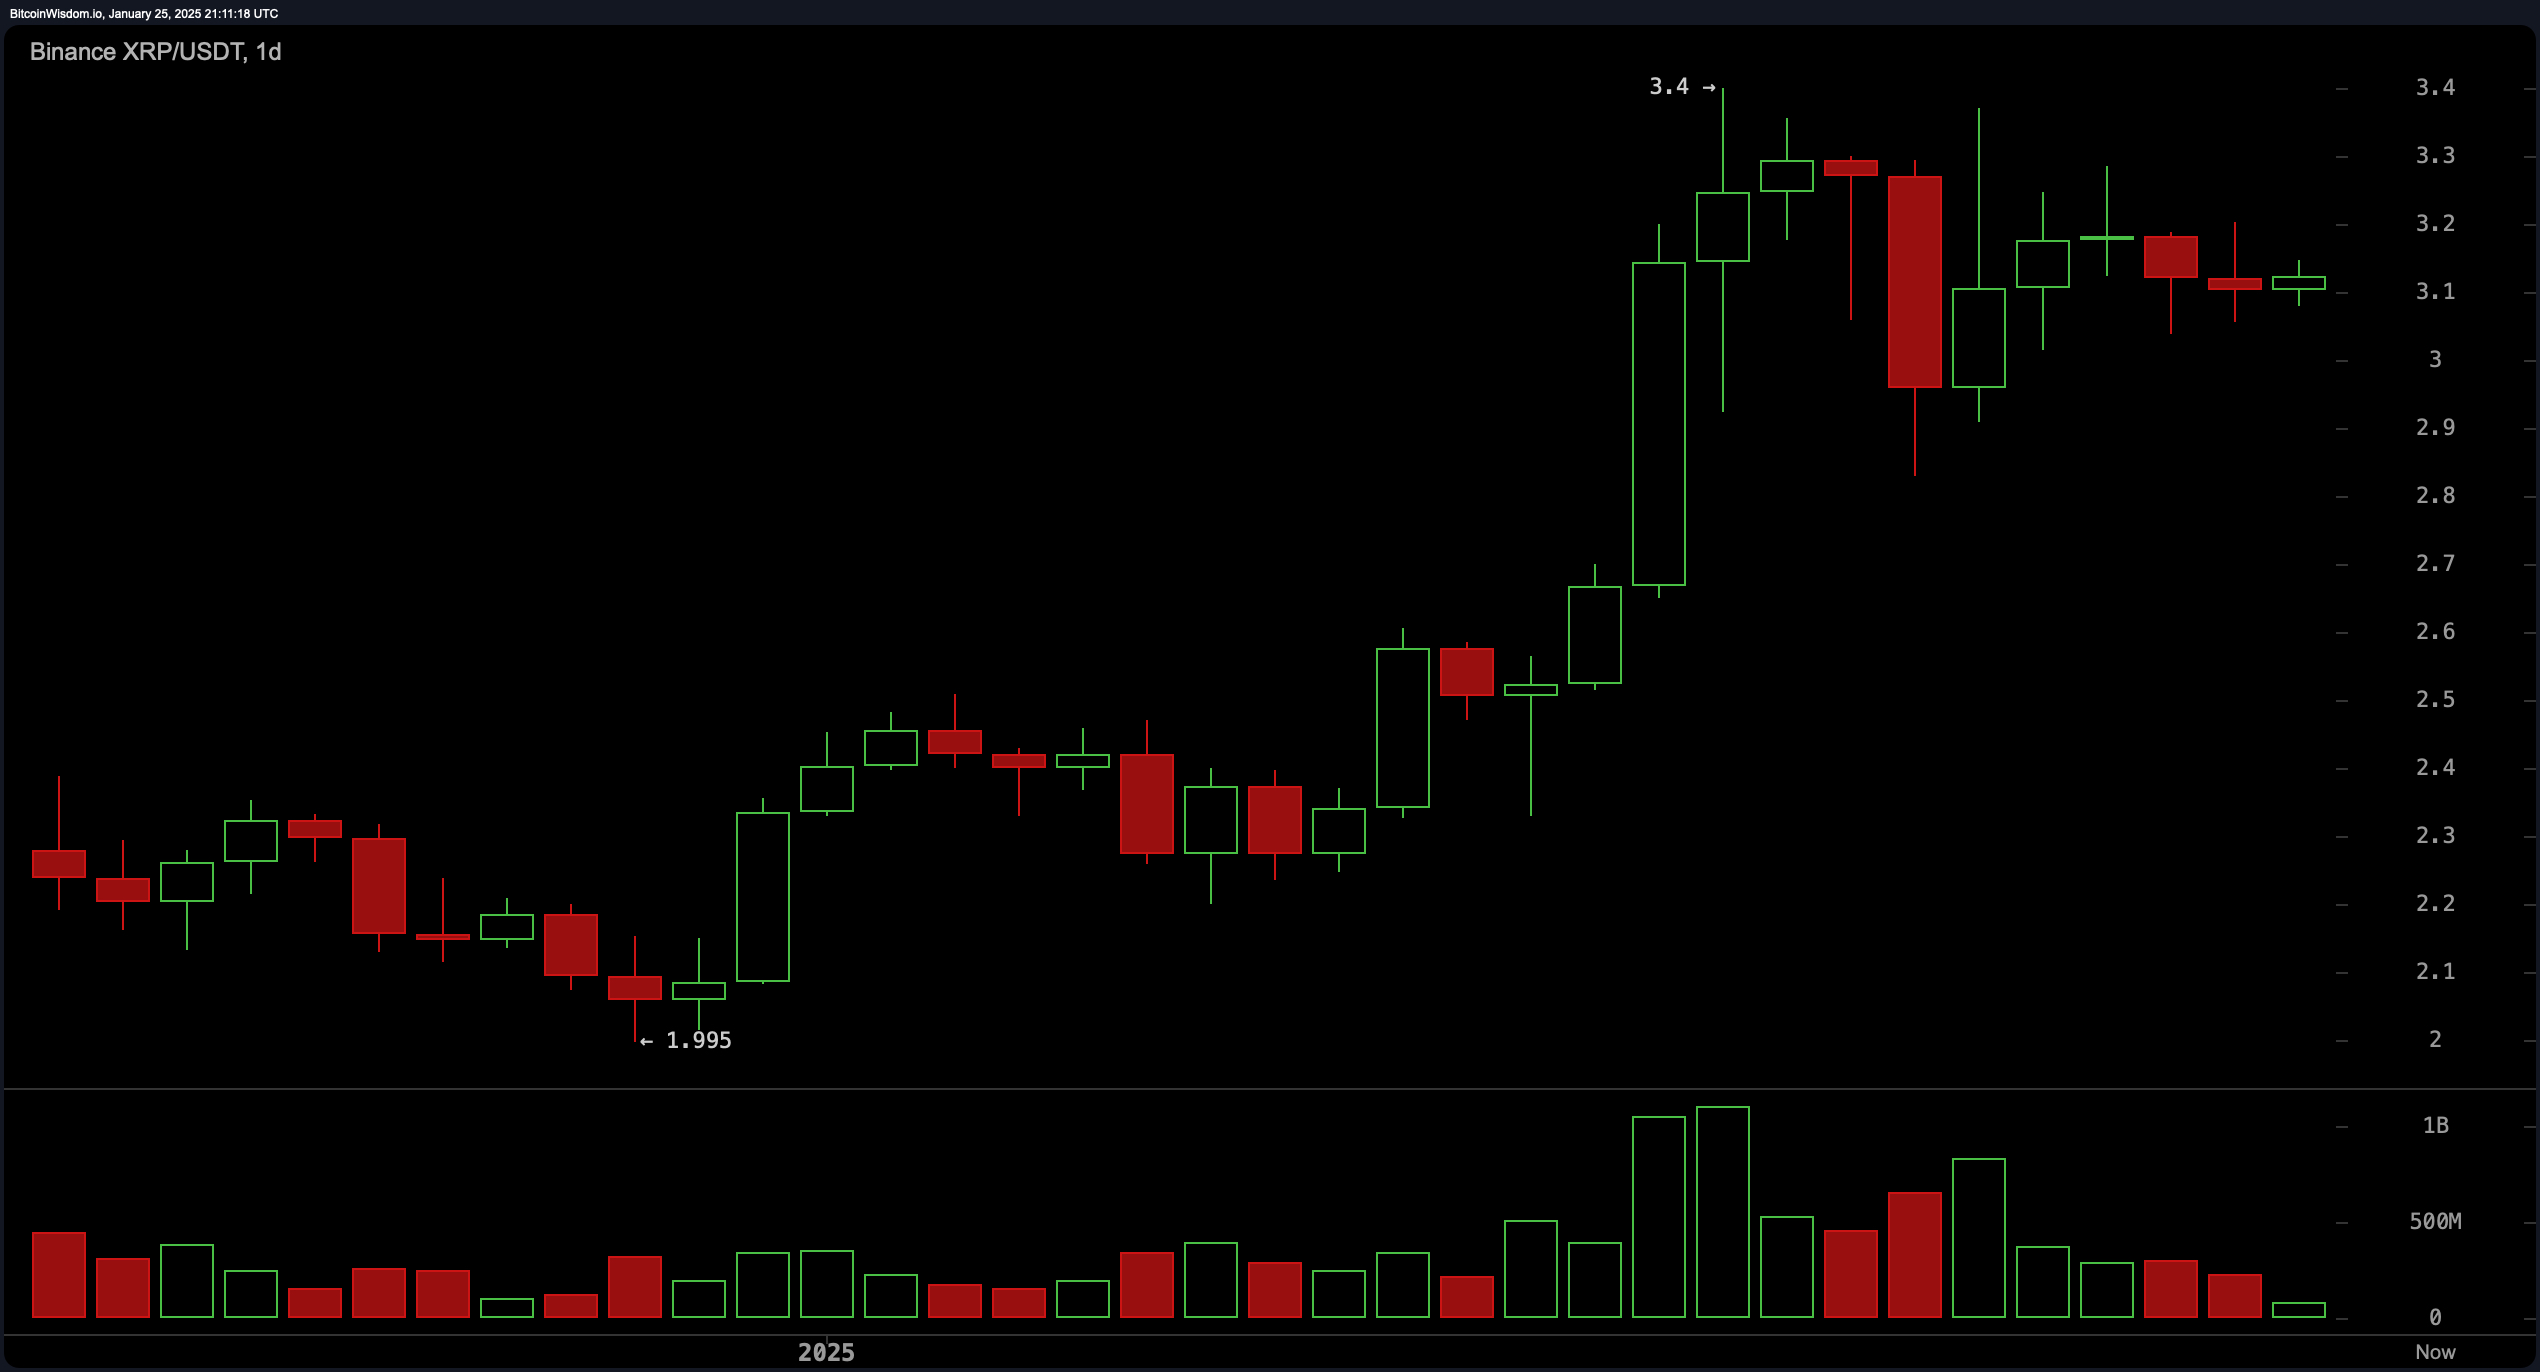
On the daily chart, XRP maintains a bullish trajectory despite recent consolidation following a peak at $3.40. The $3.00 to $3.10 level serves as critical support, while $3.40 represents a key resistance zone. Volume patterns reveal a decline in momentum, which could either precede a reversal or an extended sideways movement. Traders looking to capitalize on bullish trends should consider entering near $3.10 with an eye on $3.40, provided the support holds and volume increases.

XRP/USDT 1D chart on Jan. 25, 2025.
Oscillators indicate mixed signals, with the relative strength index (RSI) at 63.61 (neutral), stochastic %K at 73.93 (neutral), and the commodity channel index (CCI) at 56.40 (neutral). The average directional index (ADX) at 20.08 suggests a lack of strong trend direction, while the awesome oscillator reflects neutral momentum at 0.56. Momentum at -0.023 signals a potential downside bias, whereas the moving average convergence divergence (MACD) at 0.225 supports a bullish outlook.
XRP’s moving averages (MAs) highlight a predominantly bullish setup, with the exponential moving average (EMA) for 10, 20, 30, 50, 100, and 200 periods all signaling buy, alongside the simple moving averages (SMA) for 20, 30, 50, 100, and 200 periods. The SMA for 10 periods, however, indicates sell, reflecting short-term resistance. This alignment of longer-term moving averages supports a bullish trend, provided XRP sustains its position above critical support levels.
Bull Verdict:
If XRP successfully defends the $3.10 support level and breaks above $3.20 with increased volume, it could pave the way for a bullish continuation toward $3.25 and beyond. A resurgence in buying pressure, coupled with favorable momentum indicators like a rising MACD, would affirm the bullish trajectory, with $3.40 remaining the key resistance to conquer for sustained upside.
Bear Verdict:
Failure to hold the critical $3.10 support level could expose XRP to further downside risk, with prices potentially retreating to the $3.00 threshold or lower. Subdued volume and weakening short-term momentum suggest the possibility of bearish dominance, particularly if key oscillators continue to lean toward negative bias. A breach of support would likely embolden sellers and challenge the broader bullish structure.


