Chainlink (LINK) price is up roughly 4.5% in the last 24 hours and 8.2% over the past week, signaling renewed momentum. This recent growth has been supported by increasing whale accumulation and rising RSI, reflecting positive sentiment.
The bullish setup of EMA lines suggests there could still be room for further gains, though caution is needed as LINK nears overbought levels. Key support and resistance points will determine whether the current uptrend continues or faces a potential pullback.
LINK Whale Accumulation Pauses: What Comes Next?
The number of addresses holding between 100,000 and 1,000,000 LINK has been steadily increasing over the past week, rising from 525 on October 14 to 541 by October 20. This accumulation by whales coincided with LINK price rising from $11.26 to $11.95 in the same period.
However, between October 20 and October 21, the number of whale addresses holding LINK remained stable at 541, indicating a pause in accumulation.
Read more: Chainlink ETF Explained: What It Is and How It Works
Addresses Holding Between 100,000 to 1,000,000 LINK. Source: IntoTheBlock
Monitoring this metric will be key to understanding whether whales resume buying, which could signal expectations of further price increases, or if they maintain their positions, hinting at a possible consolidation or decline in LINK’s price.
Chainlink RSI Nears Overbought: More Gains Before a Pullback?
LINK’s Relative Strength Index (RSI) is currently at 63.96, up from 55 just yesterday. This increase indicates growing momentum, with buying pressure pushing the asset closer to an overbought state.
The RSI is a key indicator used to measure the speed and change of price movements. Values above 70 typically indicate overbought conditions, and values below 30 suggest oversold conditions.

With an RSI of 63.96, LINK is approaching an overbought state but hasn’t quite reached that level yet. This suggests there may still be room for the price to grow before hitting potential resistance due to overbought conditions.
If buying continues, LINK price could experience further gains before a possible correction.
LINK Price Prediction: Can LINK Get Back to $13 In October?
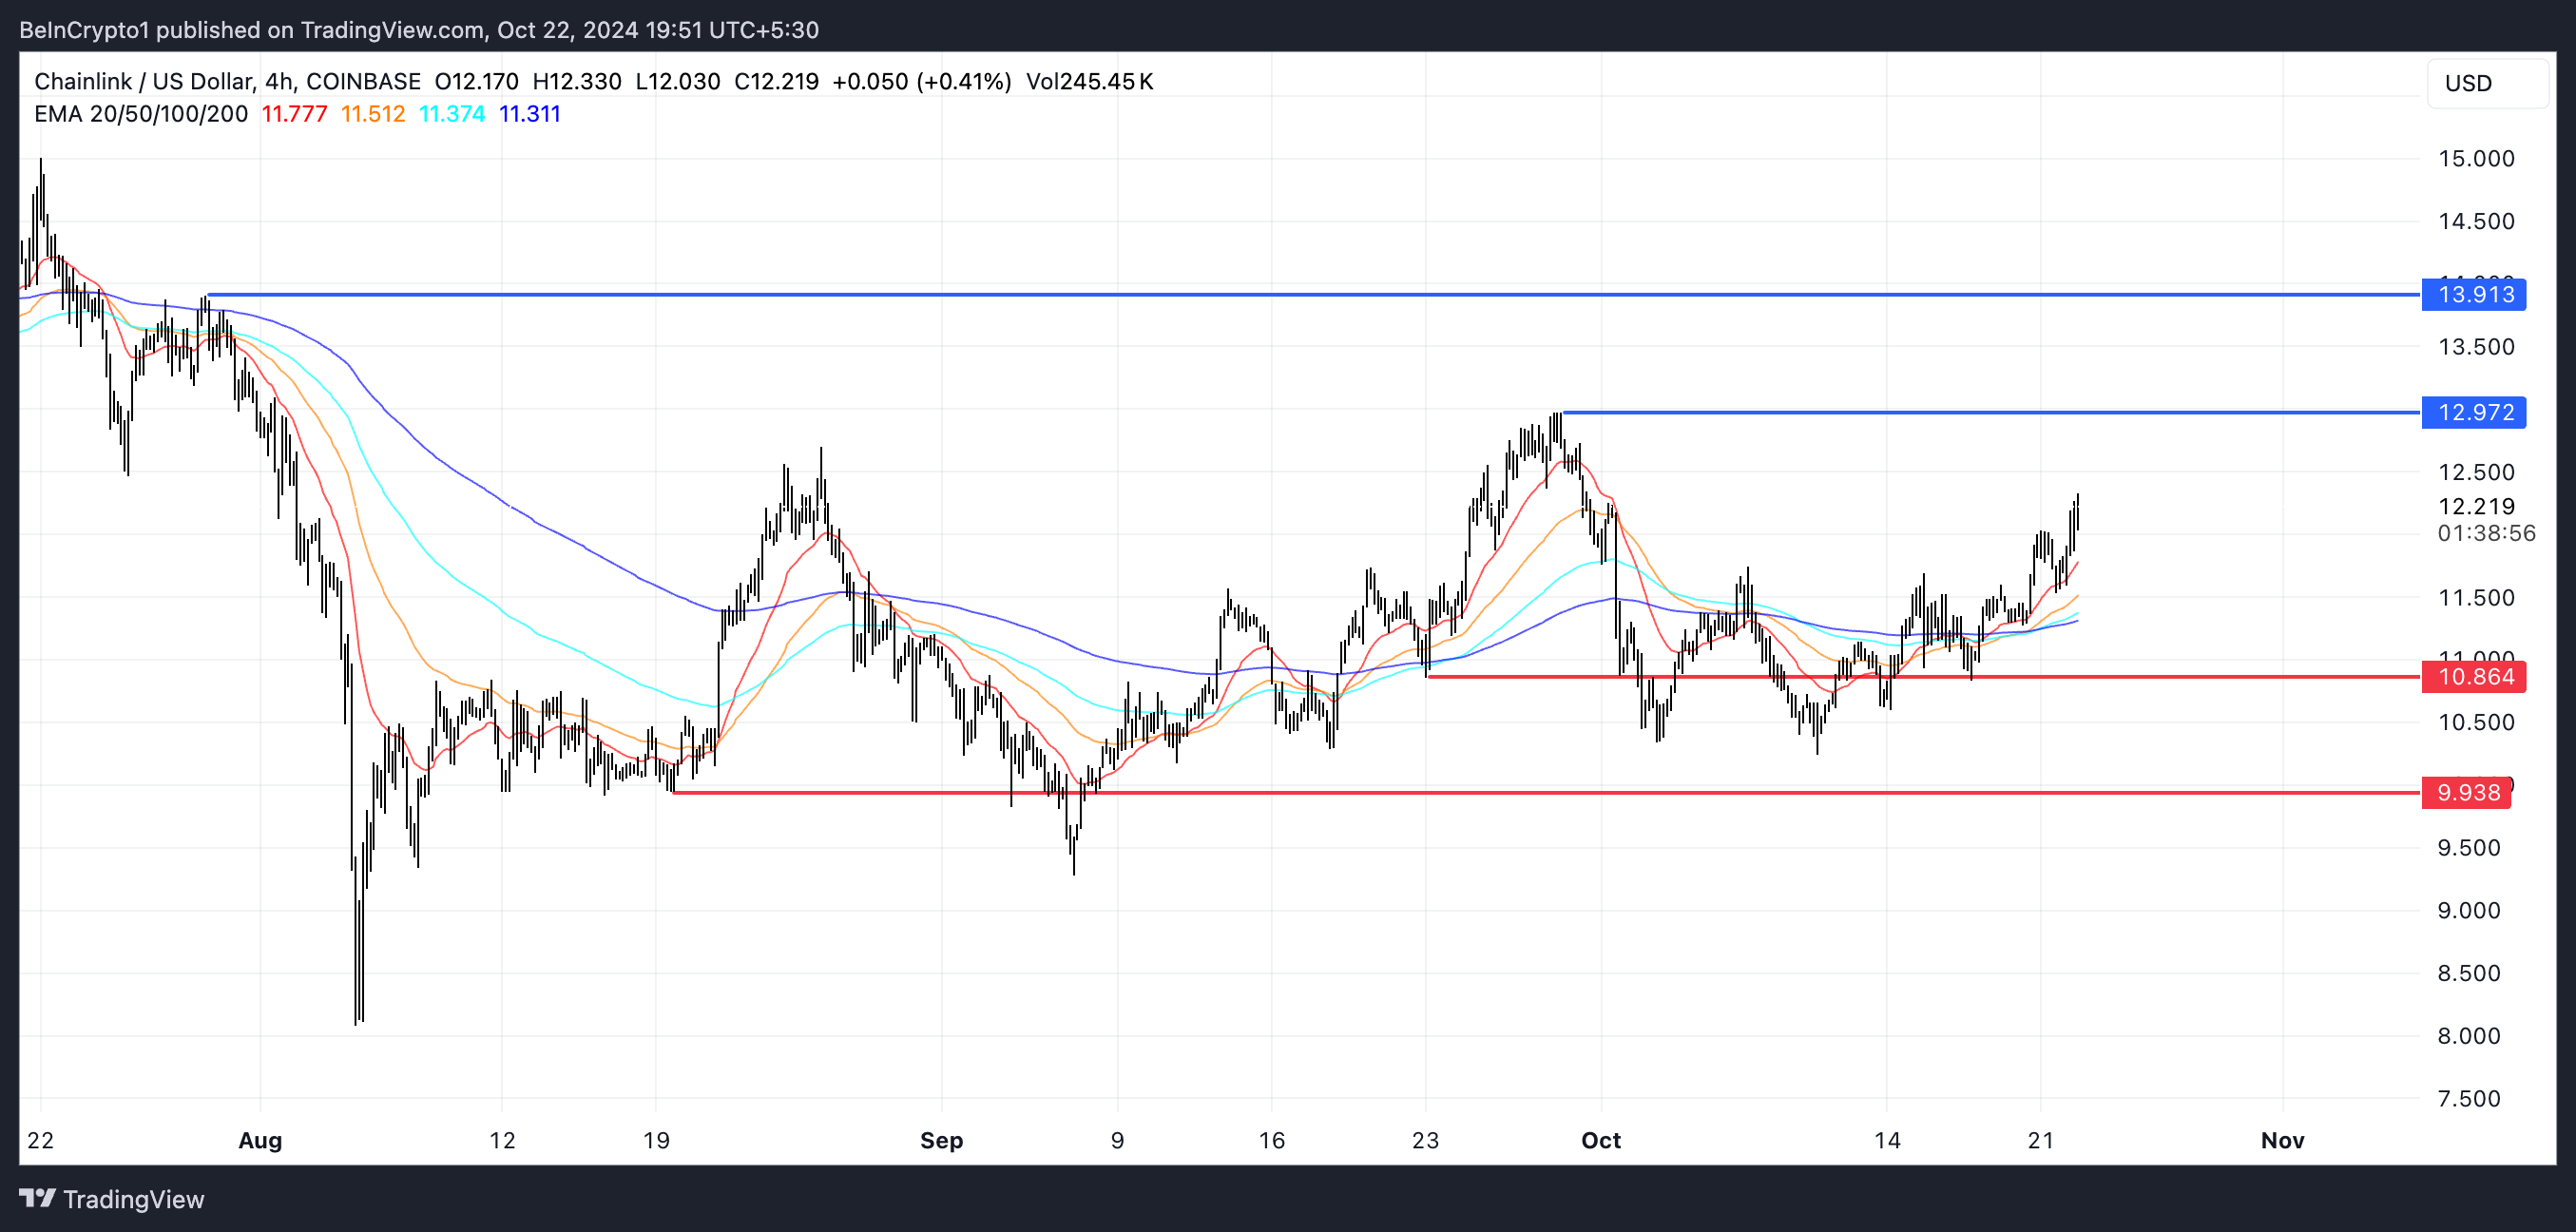
The EMA lines for LINK on the chart are showing a bullish setup, with the shorter-term EMAs above the longer-term ones. This arrangement of the EMA lines, along with their upward slope, indicates that momentum is in favor of the bulls.
The price is currently trading above all these EMAs, suggesting continued strength.
Read more: Chainlink (LINK) Price Prediction 2024/2025/2030

LINK EMA Lines and Support and Resistance. Source: TradingView
LINK also has key support and resistance levels that are important to monitor. The immediate support is at $10.86, and a break below this level could indicate a potential pullback to $9.94. That would mark an 18% price correction.
On the upside, the price is approaching resistance at $12.97. If LINK manages to break through that one, it could rise as far as $13.91, a potential 14% growth.


