While Cardano (ADA) holders anticipate a price bounce in the short term, on-chain analysis proves it may take some time.
According to data from CoinMarketCap, ADA’s price has decreased by 32.29% year-to-date (YTD). The last few months have not been better either, as signs emerge that the coming weeks may replicate similar movement.
Cardano Holders Continue Distribution
Leading this bearish outlook is the Mean Coin Age (MCA). As the name implies, the MCA is the average age of all tokens on a blockchain measured by the purchase price.
Significant changes in the average age of tokens spent or bought impact prices. For example, spikes in the coin age indicate notable trading activity. It means that old coins are being moved from wallets where they’ve been stored to more liquid facilities.
On the other hand, a low coin age suggests the accumulation of new coins. In Cardano’s situation, data from Santiment shows that the 90-day MCA has been increasing since June 1.
Cardano 90-Day Mean Coin Age. Source: Santiment
This increase indicates a rise in selling pressure, which is one reason ADA has become weak. Should the MCA reading continue to increase, ADA’s price may have no option but to decrease further.
Read more: How to Buy Cardano (ADA) and Everything You Need to Know
Traders Stay Patient
Despite the possible decrease, some traders are bullish on Cardano. The funding rate shows evidence of this.
- Funding Rate: This is the product of the difference between the contract price and the spot price. The bigger the difference, the higher the rate. A positive reading suggests that the contract price is at a premium to the spot price.
In this case, long-positioned traders pay a fee to shorts to keep their positions open. Conversely, negative funding implies that shorts pay a fee to longs while the contract price is discounted.
According to Coinglass, ADA’s Funding Rate was positive. This reinforces the assertion that traders put up bullish positions despite the underwhelming performance of the token.

Cardano Funding Rate. Source: Coinglass
In fact, pseudonymous analyst Sssebi, shared his thoughts about Cardano in a post on X. Backing his rationale, the analyst wrote:
“Bullish divergence on the daily ADA/BTC chart. Seems like ADA is hitting the bottom against BTC. We could see a very nice ADA pump soon, also considering that Chang hard fork is just around the corner.” He stated.
ADA Price Prediction: It’s a Breakdown
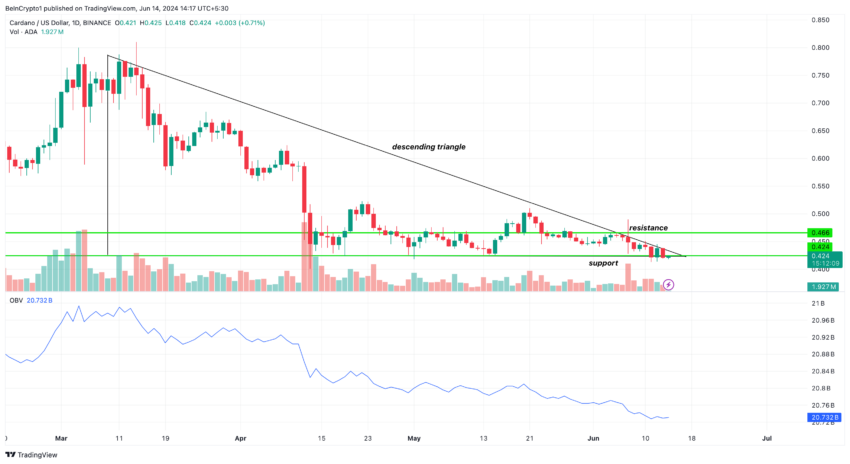
Meanwhile, BeInCrypto analyzed the cryptocurrency’s potential on the daily chart. According to our analysis, ADA has formed a descending triangle.
- Descending triangle: This refers to a bearish chart pattern characterized by a descending upper trendline and a flat horizontal trendline at the bottom. In this instance, the lower trendline acts as support.
Generally, this pattern implies that the downtrend may continue, or the token may end up consolidating.
However, other indicators need to confirm this trend. In addition, we noticed that the On Balance Volume (OBV) reading fell.
- On Balance Volume: This indicator measures positive and negative volume flow to analyze the possible trading direction. An increase in OBV implies buying pressure, while a decrease suggests selling pressure.
As shown below, the OBV on Cardano’s daily chart is down, implying intense selling pressure. If selling pressure increases, the next target for ADA will be $0.40.
Read more: Who Is Charles Hoskinson, the Founder of Cardano?

Cardano Daily Price Analysis. Source: TradingView
However, the prediction may be invalidated if bulls decide to defend the support at $0.42. Should this happen, accompanied by an increase in accumulation, ADA may key into the resistance at $0.46.
Another factor that may affect ADA’s price is the Voltaire upgrade. Recently, Cardano’s founder, Charles Hoskinson, confirmed that the upgrade may take place in Q3 while the Chang hard fork is also ready.
Based on the impact of the Alonzo hard form on ADA’s price in 2021, the Voltaire upgrade may set the stage for a bull run. However, it remains uncertain if ADA will follow the 2021 pattern when its price moves from $0.21 to $3.10 within a few months.


