- Canadian Dollar recovers lost ground but remains down for the week.
- Canada Retail Sales decline further, limiting CAD recovery.
- Broad market risk appetite recovers after US inflation expectations ease.
The Canadian Dollar (CAD) recovered ground on Friday, sparked by a shift in investor risk appetite. US Durable Goods Orders snubbed an expected decline, and Consumer 5-year Inflation Expectations in May eased slightly.
Canada saw a fresh downturn in Retail Sales in March after median forecasts expected a slight bounce. Despite further signs of economic weakness in Canada, broader market sentiment gained ground and forced the US Dollar (USD) lower after the Michigan Consumer Sentiment Index climbed higher than expected in May.
Daily digest market movers: Market sentiment rebounds, Canadian Dollar shrugs off Canadian data miss
- Canadian Retail Sales slid -0.2% MoM in March, missing the forecasted recovery to 0.0% from the previous month’s -0.1%.Canadian Retail Sales excluding Automobiles tumbled to a nine-month low of -0.6% MoM, entirely missing the forecast of 0.1%, though the previous month’s figure was revised upward slightly to -0.2% from -0.3%.
- US Durable Goods Orders in April rose 0.7%, shrugging off the -0.8% forecast, though the previous month’s print was steeply revised lower to 0.8% from 2.6%.
- The University of Michigan’s Consumer Sentiment Index printed firmly higher at 69.1 compared to the previous month’s 67.4. Median market forecasts had expected a slight uptick to 67.5.
- The UoM 5-year Consumer Inflation Expectations in May eased to 3.0% versus the expected hold at 3.1%.
- Market sentiment is recovering on Friday after a midweek spike in risk aversion sparked by a harsh rebalancing of investor rate cut expectations. The CME’s FedWatch Tool shows that rate markets are pricing in nearly-even odds of a rate cut from the Federal Reserve (Fed) in September, down sharply from 70% at the beginning of the week.
Canadian Dollar PRICE This week
The table below shows the percentage change of Canadian Dollar (CAD) against listed major currencies this week. Canadian Dollar was the strongest against the Australian Dollar.
| USD | EUR | GBP | JPY | CAD | AUD | NZD | CHF | |
|---|---|---|---|---|---|---|---|---|
| USD | 0.18% | -0.31% | 0.85% | 0.36% | 1.03% | 0.27% | 0.58% | |
| EUR | -0.18% | -0.52% | 0.73% | 0.19% | 0.89% | 0.10% | 0.41% | |
| GBP | 0.31% | 0.52% | 1.10% | 0.73% | 1.40% | 0.62% | 0.92% | |
| JPY | -0.85% | -0.73% | -1.10% | -0.49% | 0.19% | -0.55% | -0.26% | |
| CAD | -0.36% | -0.19% | -0.73% | 0.49% | 0.62% | -0.09% | 0.21% | |
| AUD | -1.03% | -0.89% | -1.40% | -0.19% | -0.62% | -0.79% | -0.48% | |
| NZD | -0.27% | -0.10% | -0.62% | 0.55% | 0.09% | 0.79% | 0.30% | |
| CHF | -0.58% | -0.41% | -0.92% | 0.26% | -0.21% | 0.48% | -0.30% |
The heat map shows percentage changes of major currencies against each other. The base currency is picked from the left column, while the quote currency is picked from the top row. For example, if you pick the Canadian Dollar from the left column and move along the horizontal line to the US Dollar, the percentage change displayed in the box will represent CAD (base)/USD (quote).
Technical analysis: Canadian Dollar pulls back from bearish edge but is still broadly lower for the week
The Canadian Dollar (CAD) pared some of the week’s losses on Friday, but still remains firmly lower against most of its major currency peers compared to Monday’s opening bids. The Canadian Dollar extended gains to two-thirds of a percent against the Australian Dollar (AUD) this week, while holding a third of a percent higher against the Japanese Yen through the week.
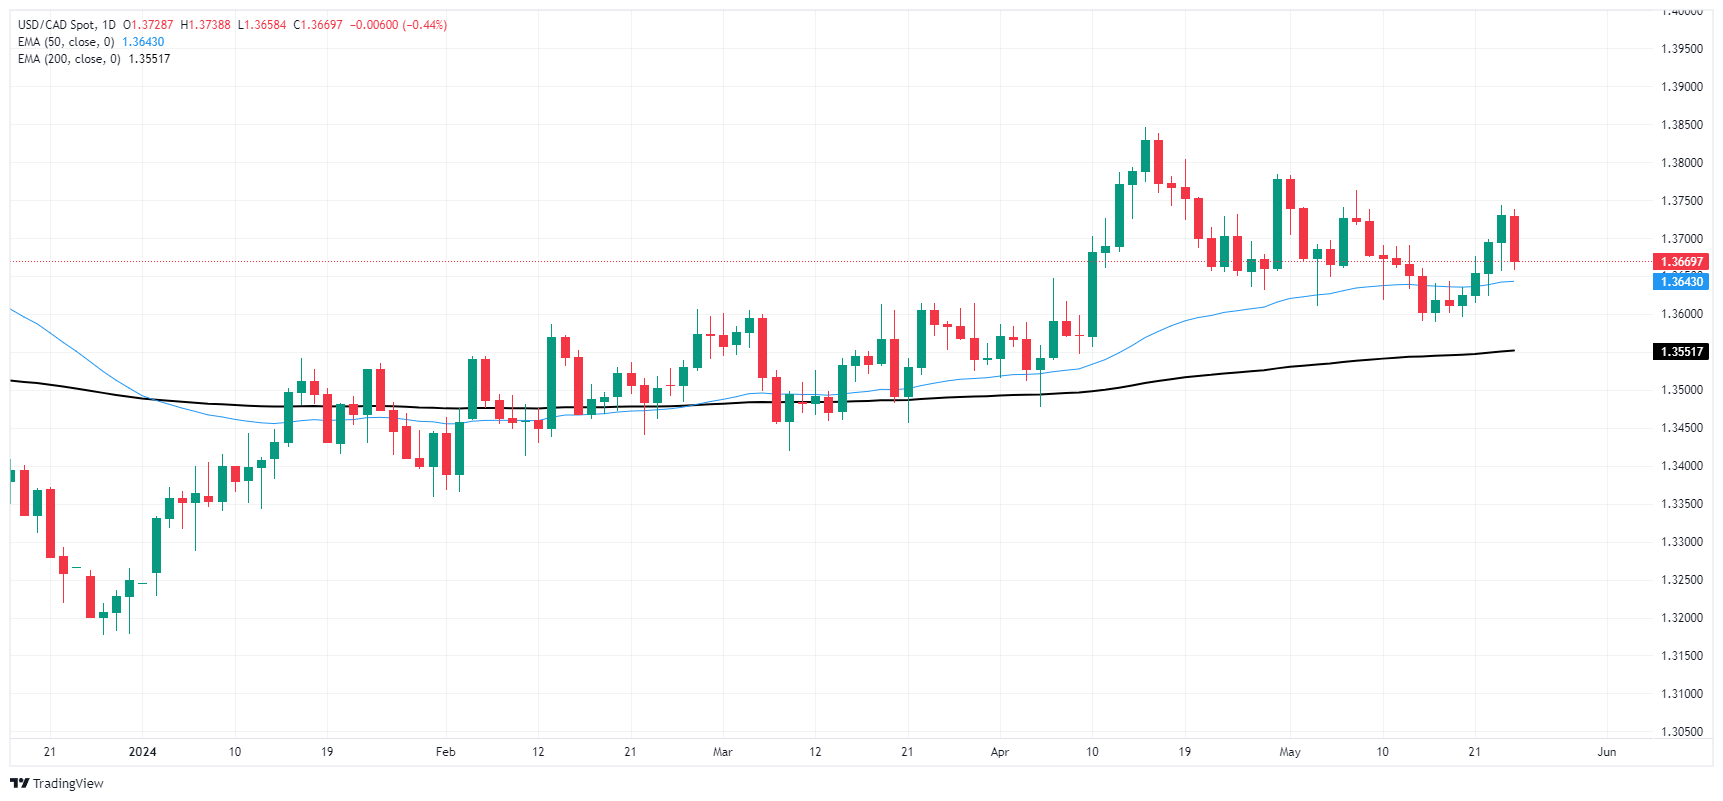
Despite a firm Friday rebound, the CAD remains down four-tenths of one percent against the Greenback as the US Dollar remains one of the week’s strongest performers. USD/CAD pulled back to 1.3670 during Friday’s US market session, dipping from the week’s highs near 1.3745. However, the pair still remains higher on the week, trading on the high side of a technical bounce from the 1.3600 handle.
Choppy chart conditions hold USD/CAD near the 200-hour Exponential Moving Average (EMA) near 1.3668. Further bearish momentum will find a firm price floor at the 200-day EMA at 1.3553.
USD/CAD hourly chart
USD/CAD daily chart
Economic Indicator
Last release: Fri May 24, 2024 14:00
Frequency: Monthly
Actual: 3%
Consensus: 3.1%
Previous: 3.1%
Source: University of Michigan


