As the larger market saw a pullback amid bearish blues, most of the altcoins bled. Avalanche price experienced a price rally in March when it exceeded a 50% increase. However, current market trends exhibit signs of a decline which raises concerns about AVAX price maintaining its current downward trend.
Technical indicators are showing signs of a bearish market that raises investor concerns about AVAX price potentially sinking to $7 or even lower levels. A deeper dive into its price action can show us what to expect in the short-term from Avalanche.
Avalanche Price Rally and the Breakdown
Notably, Avalanche price experienced a sustained price surge between March 11 and March 26 as its market value rose from $15.27 to $23.46.
Traders have interpreted this price rise favorably because it restored the $20 support area. The $20 level had been a critical zone for AVAX since 2022, offering both support and resistance throughout its price action.
However, in the last week, the price showed a sudden reversal from its upward momentum. The price dropped below $20 to indicate a breakdown in its bullish trajectory.
Consequently, market sentiment turned negative after AVAX price broke through its $20 support point thus threatening the potential short-lived gains from March’s bullish momentum.
As the price continues to fall, attention shifts toward the possibility of further declines, with some analysts predicting that the downward trend may push the price to new lows.
Key Support Levels and the Risk of New Lows
Avalanche price downward trajectory has created critical support points for investors to watch. Analysts and traders see the $9.50 along with $7 price points as key points of attention. The analysts have monitored these level points to confirm whether AVAX prices will sustain their downward movement or approach stable support zones.
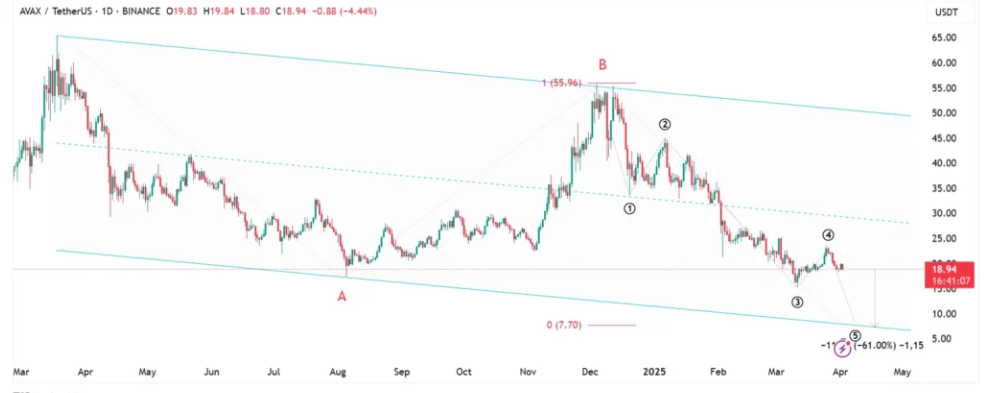
According to analyst Ali Martinez, Avalanche price is currently breaking through a descending channel to potentially reach levels near $7. The price is testing lower support levels, and the trend seems to be heading toward a critical area, with $7 being a target.
Avalanche Price Chart Source: X
In the analysis, Avalanche AVAX price sustained tight price movement from late March until it finally broke the support.
The current market bearish trend indicates AVAX might continue its downward trajectory throughout the near future. A failure of the price to maintain support at $16.50 could initiate a movement toward $7.
More so, the daily chart supports a bearish outlook for AVAX, with the price showing a corrective A-B-C pattern that has been ongoing since March 2024.
According to the wave count, AVAX is currently in the final phase, wave C, which suggests more downward movement is likely. Based on the sub-wave analysis, it may reach a new low below the $16 level to develop wave five.

Avalanche Price Chart Source: Tradingview
Bearish Technical Indicators Signal Continued Decline
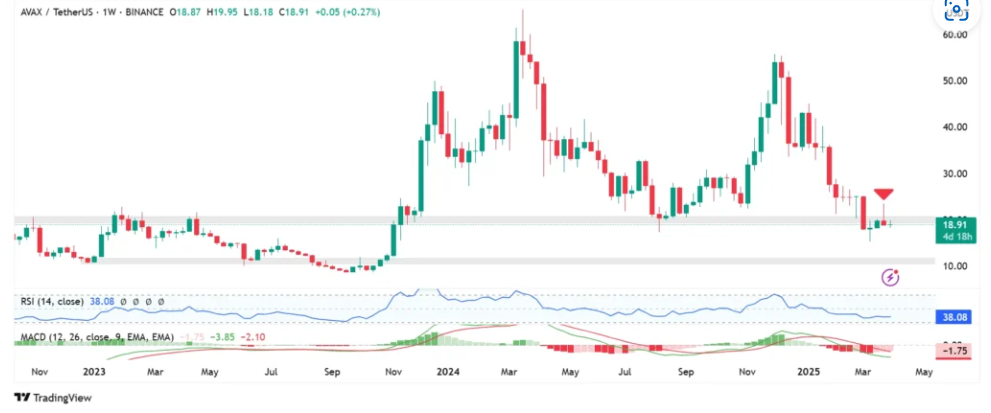
Analyzing weekly and daily technical trends, there are bearish outlooks for AVAX price. The weekly chart shows declining Relative Strength Index (RSI) and Moving Average Convergence Divergence (MACD). The RSI indicator is below 50 showing bearish market momentum. Likewise, the MACD line has fallen below the signal line indicating a highly bearish trend in the market.

Avalanche Price Chart Source: Tradingview
Therefore, analyzing the above technical indicators, AVAX price may not bounce back quickly after the breakdown. This downtrend might be escalating to bearish territory, where the price could drop even further, triggering a shift in the investors’ sentiment.
At the time of writing, Avalanche price is trading at $19.30, reflecting a 0.96% decline over the past 24 hours. The price experienced fluctuations, reaching a high of $19.68 before retracing, with support potentially near $19.00.


