


On Friday, XRP traded between $2.425 and $2.50 over the last hour, with a market capitalization of $144 billion and a global trade volume of $7.03 billion over the past 24 hours, while its intraday price ranged from $2.41 to $2.63.
XRP
On the 1-hour chart, XRP shows a consolidation pattern with lower highs and higher lows, indicating a possible breakout. Support is established at $2.45 to $2.50, while resistance is evident at $2.65 to $2.70. A sharp drop to $2.37 was swiftly bought up, signaling strong demand at lower levels. Volume spikes at dips suggest accumulation, potentially supporting a bullish move if momentum holds. If XRP breaks above $2.65, a move toward $2.75 to $2.85 is likely, whereas a decline below $2.45 could push the price toward $2.35.
XRP/USDT via Binance 1H chart on March 7, 2025.
The 4-hour chart reflects a bullish rally from $2.13 to nearly $3.00, followed by a correction that stabilized around $2.50 to $2.60. Resistance is set at $2.80 to $2.90, with support at $2.40 to $2.50. The recent pullback exhibited low selling volume, indicating weakening bearish pressure. Should XRP maintain its footing above $2.50, it may attempt another rally toward the $2.90 to $3.00 range. However, a breach below $2.40 could invite further downside, testing the $2.20 to $2.30 region.
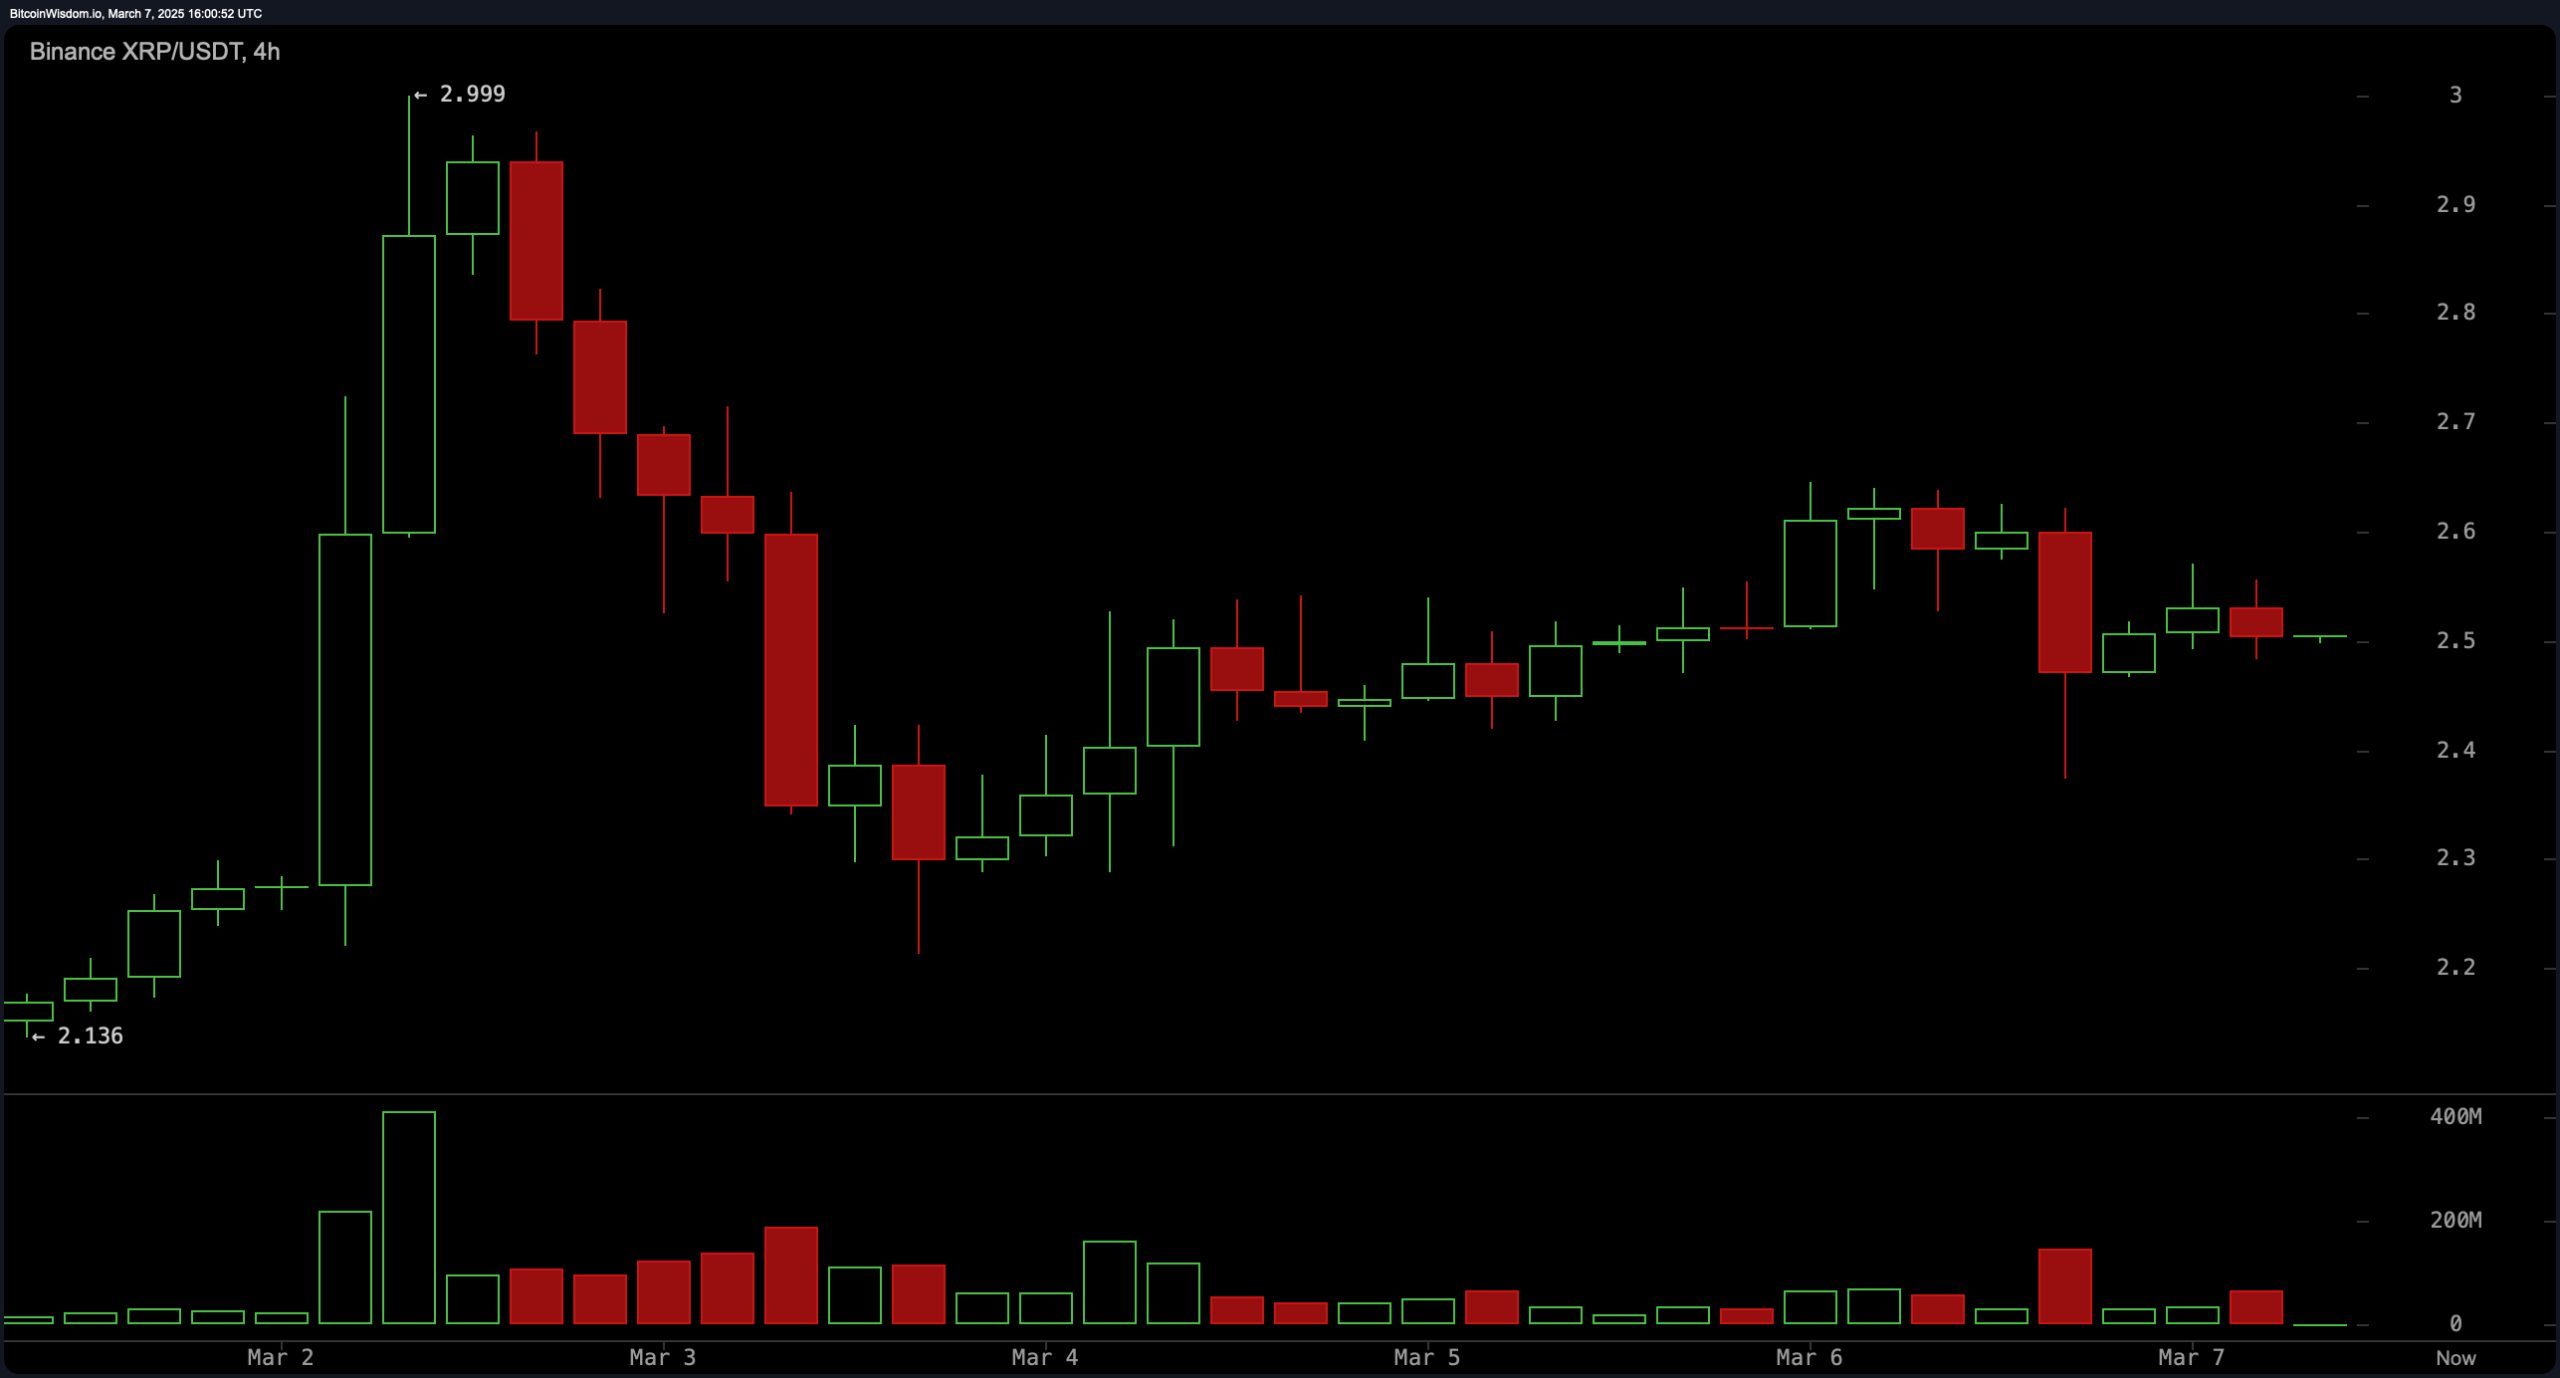
XRP/USDT via Binance 4H chart on March 7, 2025.
On the daily chart, XRP continues its recovery after a major drop, consolidating between $2.50 and $2.60. A breakout above $2.50 occurred but faced resistance near $3.00, prompting a retracement. The price is forming higher lows, a bullish signal if upward momentum continues. Key resistance levels are at $3.00 and $3.15, while major support lies in the $2.20 to $2.30 zone. If buying pressure sustains, XRP could aim for a retest of the $3.00 level, though a failure to hold above $2.40 might lead to extended declines.
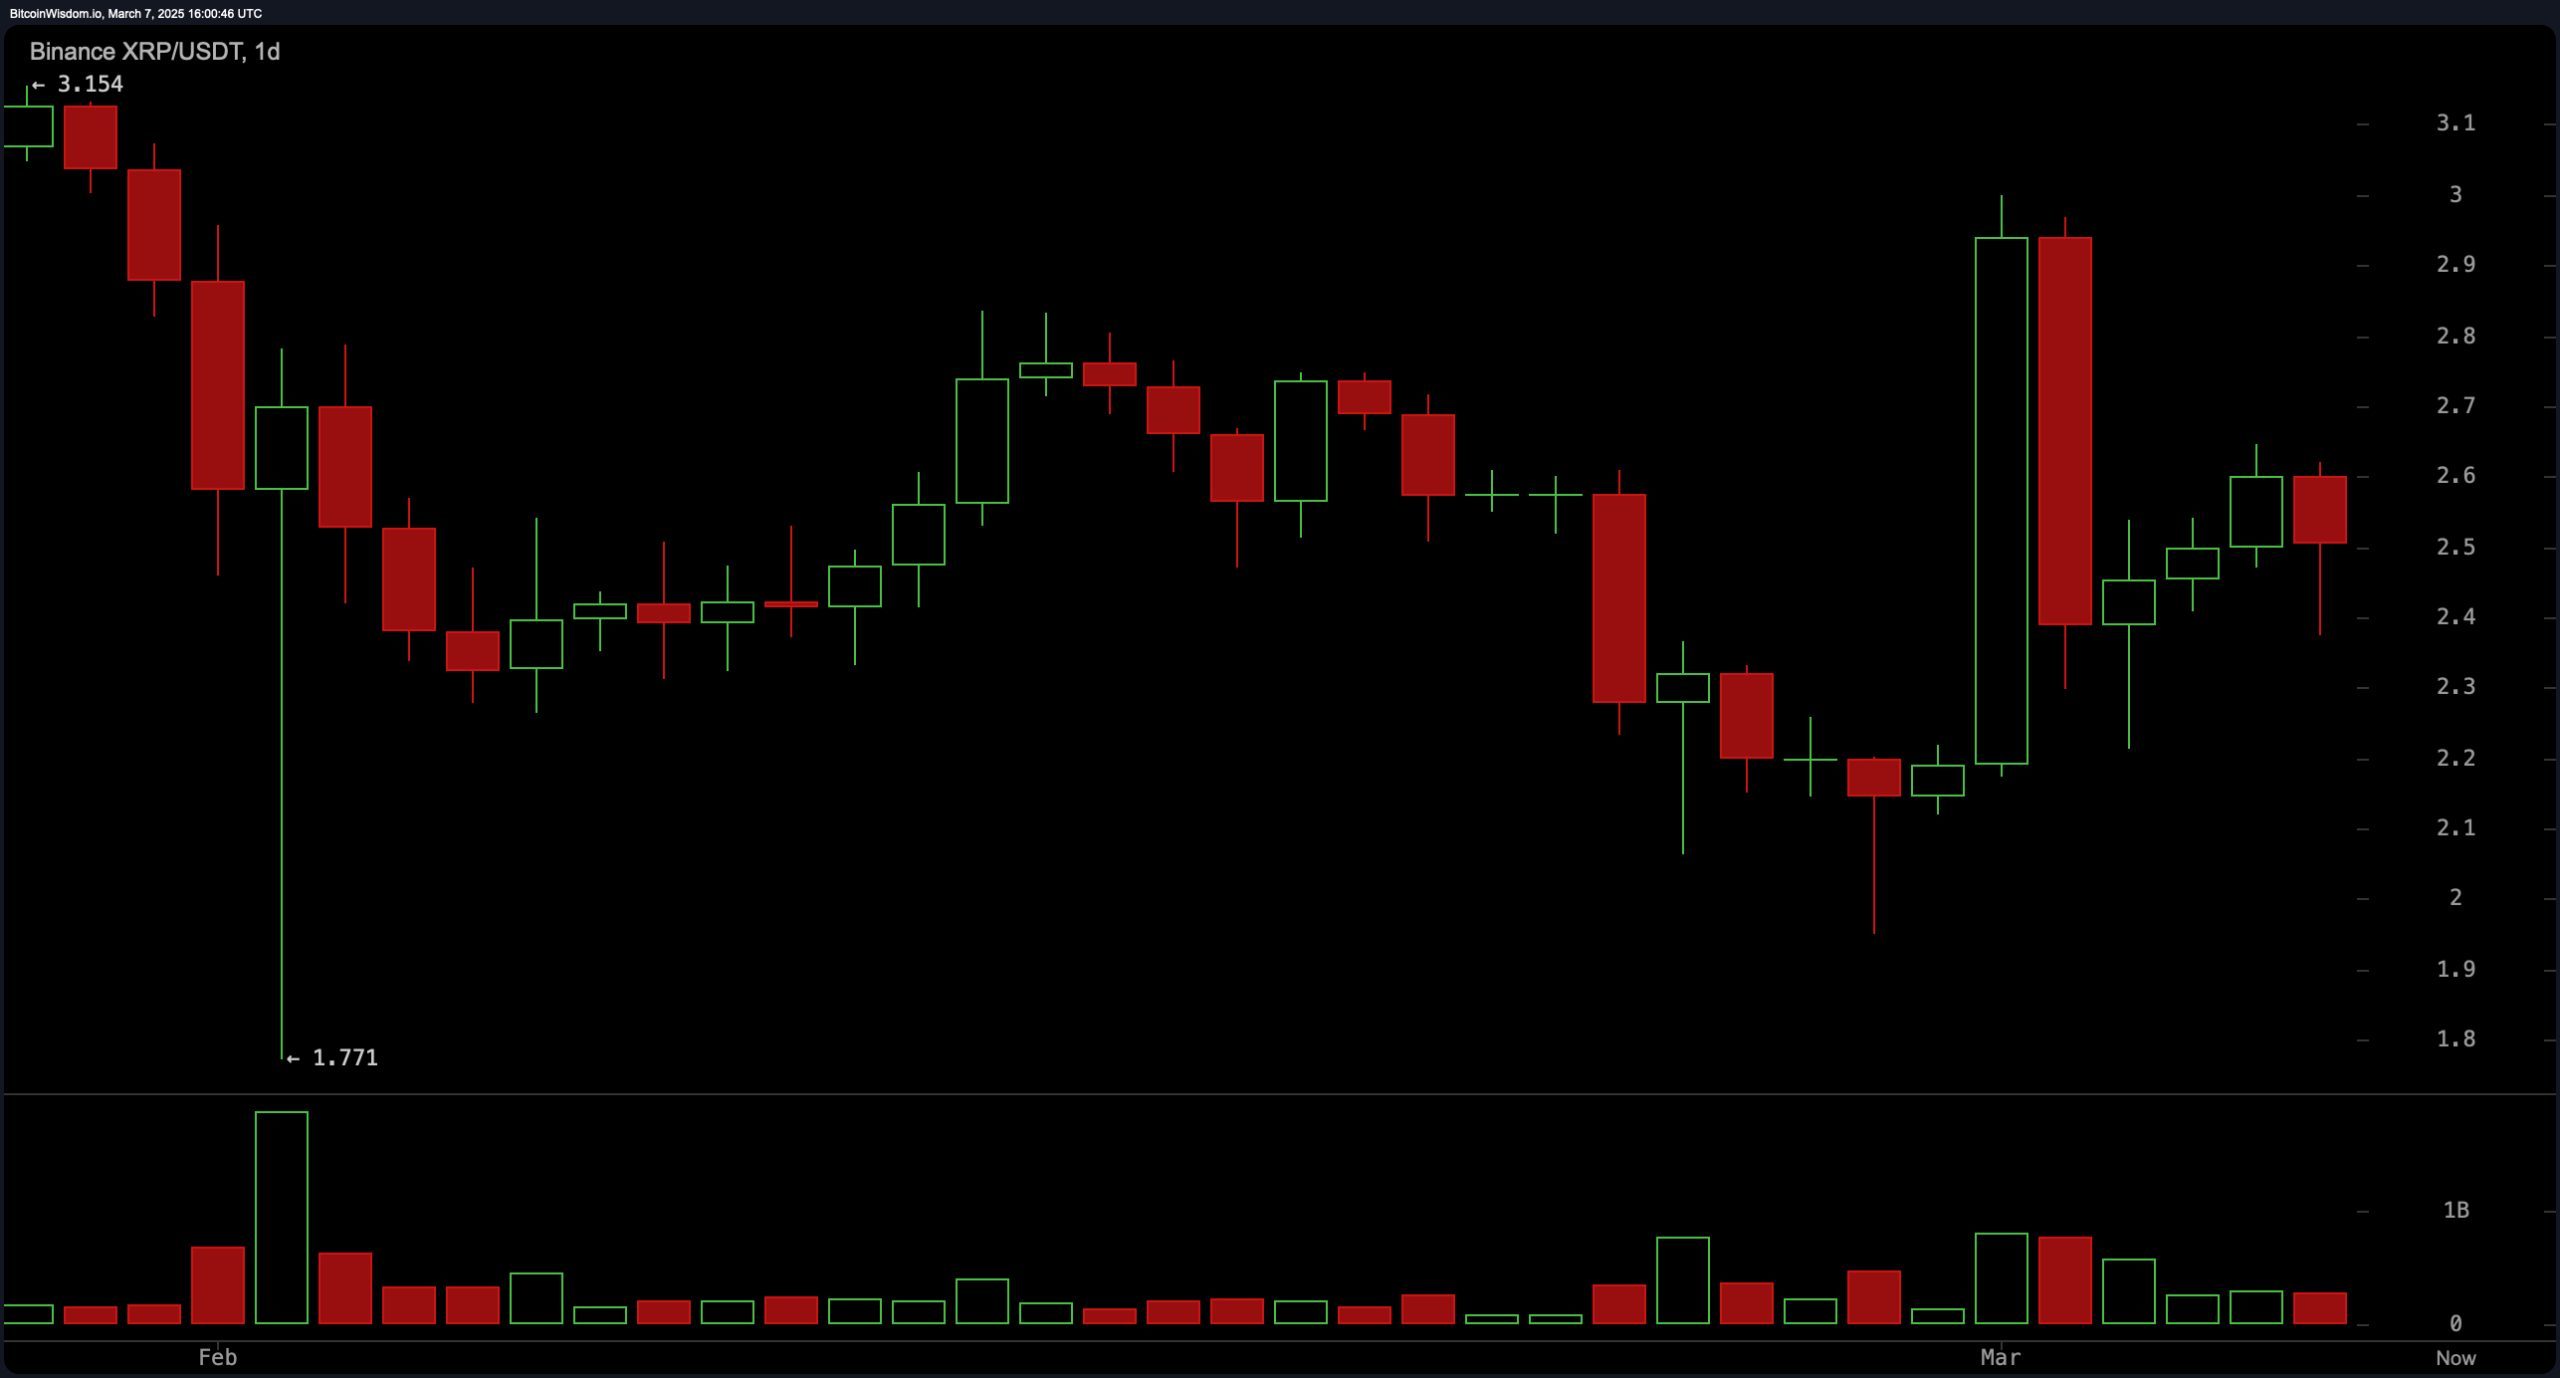
XRP/USDT via Binance 1D chart on March 7, 2025.
Oscillators provide mixed signals, with the relative strength index (RSI) at 49.83, Stochastic at 54.28, commodity channel index (CCI) at 7.55, average directional index (ADX) at 25.99, and the awesome oscillator at 0.024, all maintaining a neutral stance. Momentum (10) stands at 0.1875, signaling a sell, while the moving average convergence divergence (MACD) level at -0.03243 indicates a buy. These readings suggest indecision in the market, with neither bulls nor bears firmly in control.
Moving averages reflect a mix of bullish and bearish indications. The exponential moving averages (EMA) of 10, 20, and 100, along with the simple moving averages (SMA) of 10, 20, and 30, suggest a buying signal, while the EMA of 30, 50, and 200, as well as the SMA of 50 and 100, indicate selling pressure. This divergence suggests that while shorter-term trends lean bullish, longer-term trends remain uncertain. A sustained move above key resistance levels could shift sentiment more decisively in favor of buyers.
Bull Verdict:
XRP’s ability to hold above $2.50, combined with strong accumulation at lower levels, suggests bullish momentum could push prices toward $2.90 to $3.00 in the near term. If volume confirms a breakout above $2.65, buyers may regain control, setting the stage for further gains.
Bear Verdict:
Failure to sustain support above $2.50 and a break below $2.40 could trigger increased selling pressure, potentially driving XRP toward $2.20 to $2.30. With mixed signals from oscillators and moving averages, a bearish continuation remains possible if downward momentum strengthens.


