XRP’s current trading performance reflects a tug-of-war between bullish momentum and short-term corrections, with its price resting at $2.56.
XRP
On the 1-hour chart, XRP experienced an intraday price swing between $2.46 and $2.621, driven by strong buying and selling activity as evidenced by a volume spike near the day’s peak. However, subsequent profit-taking led to a pullback, stabilizing the price at $2.55, which now serves as a tentative support zone. The relative strength index (RSI), standing at 73.96, currently indicates overbought conditions, potentially signaling a cooling-off period. Meanwhile, XRP’s moving average convergence divergence (MACD) level of 0.43549 supports a bullish outlook, aligning with buy signals from the 10-period exponential moving average (EMA) at $2.29.
XRP/USD price via the 1-hour chart on Coinbase on Dec. 8, 2024.
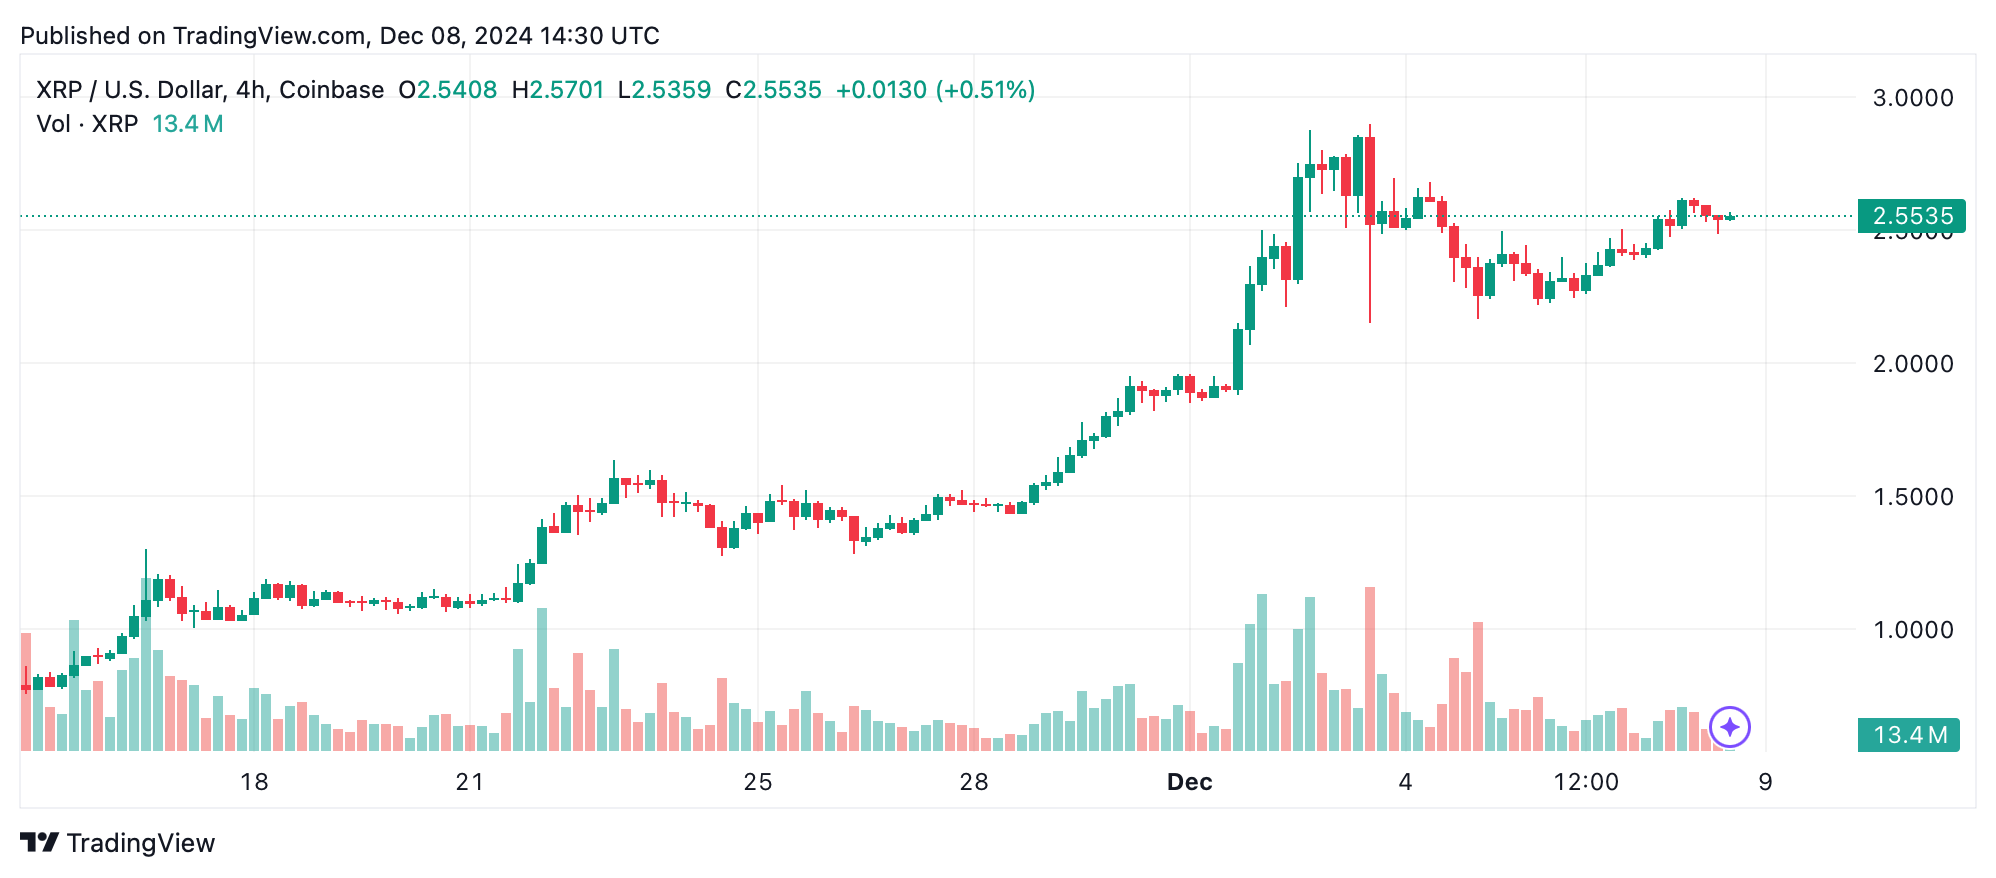
Zooming out to the 4-hour chart, XRP has been recovering steadily from a local low of $2.178, following a retracement from its recent high of $2.91. While the recovery appears consistent, the slowing upward momentum is evident in smaller movements forming near the $2.55–$2.60 range. A tapering volume trend further reflects market indecision. Traders should probably monitor XRP’s price action closely, as a break above $2.60 with increasing volume could indicate a continuation of the uptrend, while a breach below $2.50 might trigger a retest of the $2.35–$2.40 support range.

XRP/USD price via the 4-hour chart on Coinbase on Dec. 8, 2024.
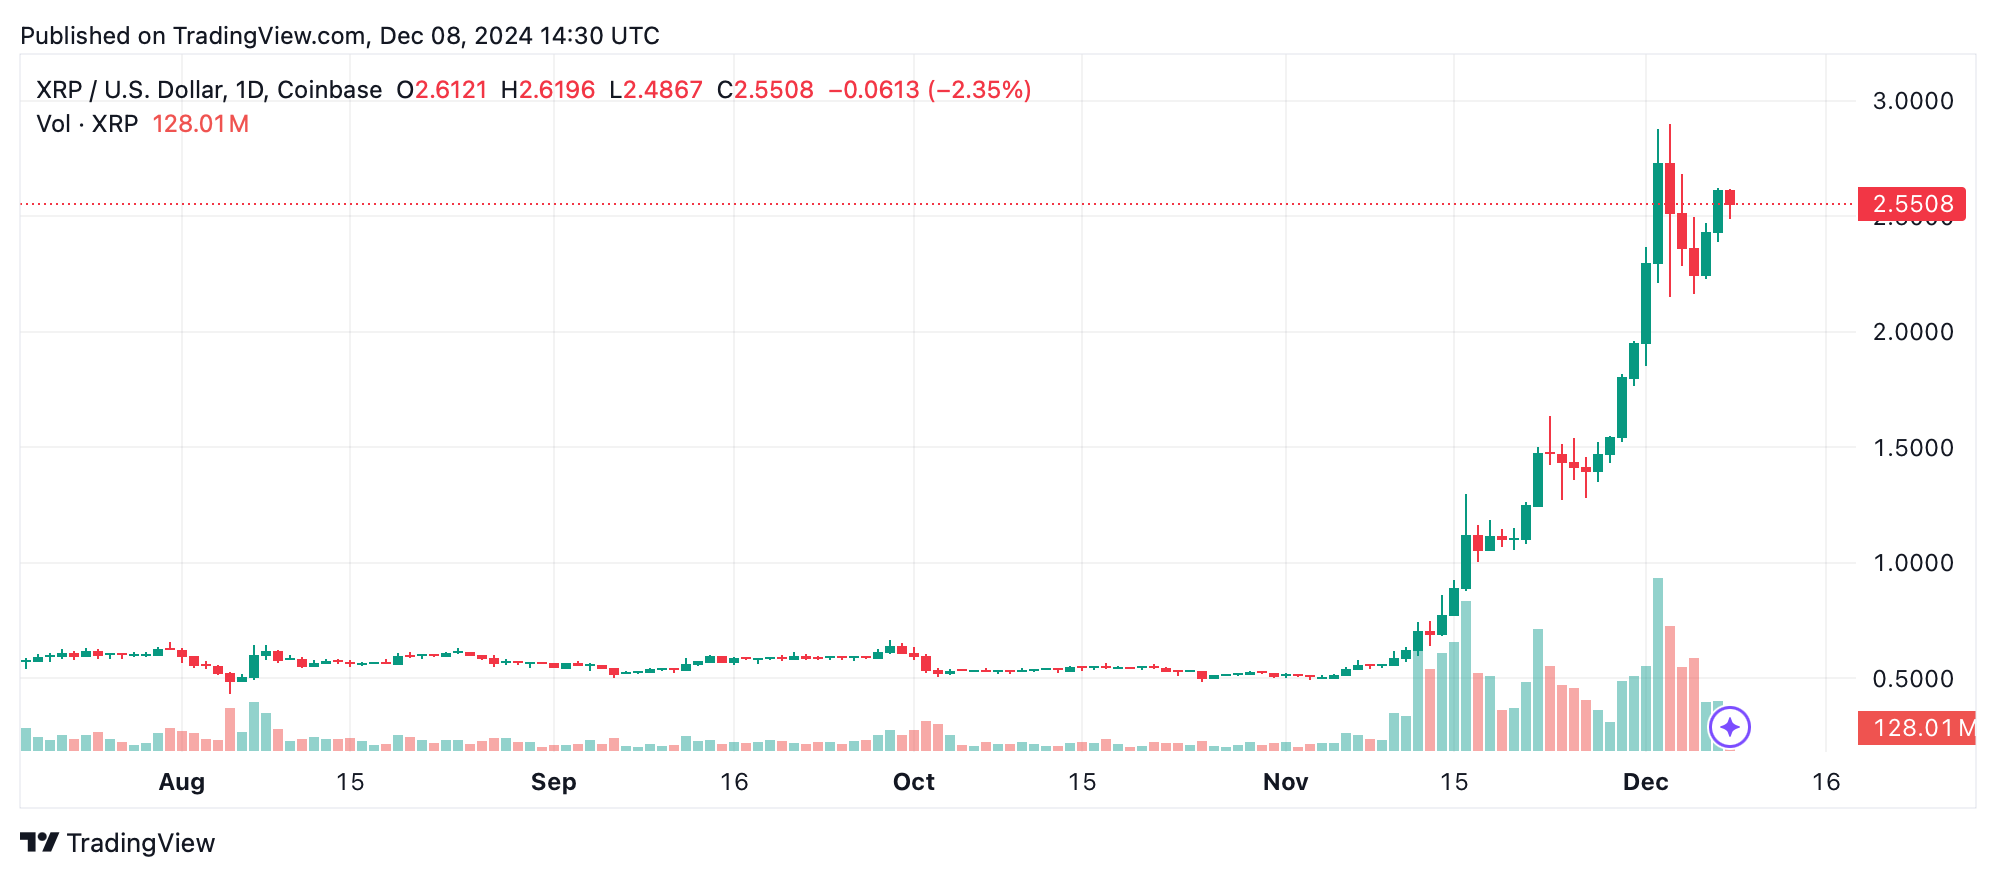
XRP’s daily chart currently offers a broader perspective, highlighting a very strong bullish rally that started near $0.49 in early November, peaking at $2.91. This rally has since entered a natural correction phase, with XRP finding stability above the $2.50 range. This critical level has been pivotal for maintaining the broader uptrend. However, diminishing volume following the peak indicates waning enthusiasm among both XRP buyers and sellers. Just like before, a daily close above $2.60 with rising volume could renew bullish momentum, targeting the $2.75–$2.91 range or possibly higher. Conversely, a break below $2.50 may suggest a deeper correction toward $2.20.

XRP/USD price via the daily chart on Coinbase on Dec. 8, 2024.
Oscillator and moving average data further support the bullish narrative, albeit with caution. Following last week’s XRP price drop, traders are on edge. While the Stochastic oscillator (77.13) and commodity channel index (CCI) at 97.41 remain neutral, the MACD’s positive value aligns with upward momentum.

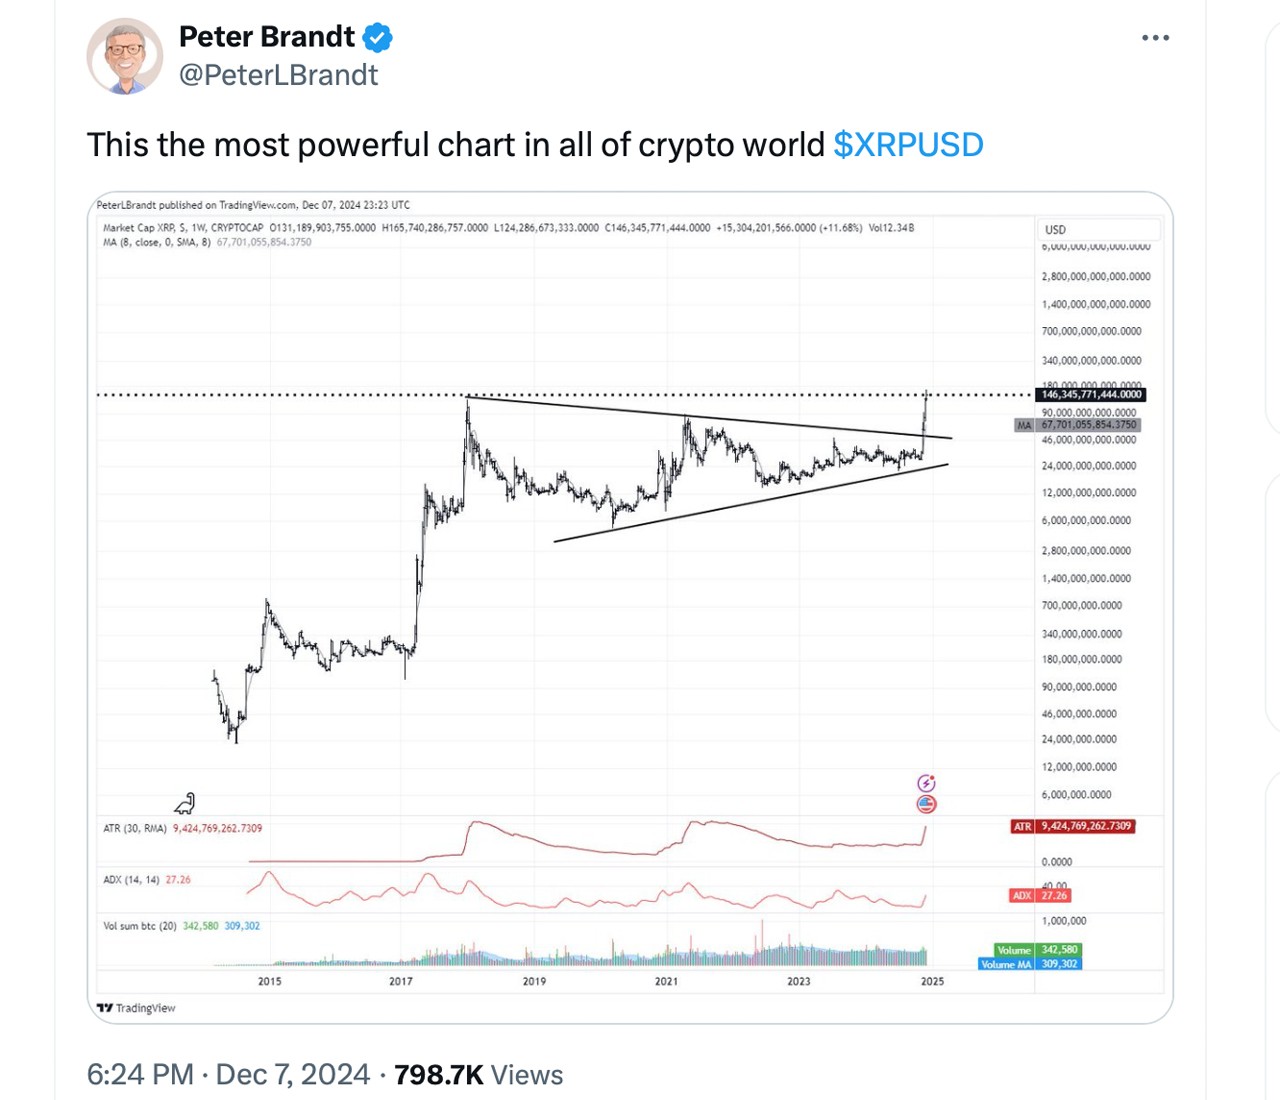
Veteran trader Peter Brandt on XRP/USD via X.
Additionally, all of XRP’s key moving averages, including the 20-period simple moving average (SMA) at $1.8579 and the 200-period EMA at $0.8116, signal strong and positive conditions, showcasing long-term optimism.
Bull Verdict:
XRP’s technical indicators strongly favor a bullish continuation, provided key support levels hold firm. A breakout above $2.60, accompanied by rising volume, could propel the price toward its recent high of $2.91, supported by buy signals across all major moving averages and the moving average convergence divergence (MACD). This outlook aligns with sustained optimism from both short- and long-term perspectives.
Bear Verdict:
Despite XRP’s bullish momentum, overbought signals from the relative strength index (RSI) and waning volume after the recent peak suggest high caution. A decisive break below $2.50 could unravel the recent uptrend, potentially driving the price toward the $2.20 range. This would indicate stronger profit-taking and growing bearish pressure, challenging the sustainability of XRP’s current rally.


