


- Bitcoin’s 273-day post-halving mark suggests more upside based on historical patterns.
- Key support at $73.7K holds, aligning with 38.2% Fibonacci retracement and filled FVG zones.
- Despite low volume, BTC’s structure shows higher lows and potential for a breakout above $80K.
Bitcoin is trading near the $80,000 mark as analysts point to a combination of historical halving data and technical indicators suggesting that the current market cycle may still have room to run. The latest analysis highlights patterns from past halving events and emphasizes a key support level that has previously marked reversal zones.
On April 8, Bitcoin reached $79,962.93, marking a 2.19% increase over the previous 24 hours. This movement came despite a 22.90% decline in trading volume, which fell to $62.57 billion. Market capitalization rose to $1.58 trillion, supported by a circulating supply of 19.84 million BTC. Bitcoin’s Fully Diluted Valuation (FDV) now stands at $1.67 trillion.
Source: CoinMarketCap
Halving Cycle Timelines Suggest Potential for Further Upside
Crypto analyst Jelle shared a chart on X (formerly Twitter) showing that Bitcoin’s all-time highs occurred much later after each halving event in past cycles. The data presented includes 357 days post-halving in 2013, 518 days in 2017, and 546 days in 2021. By comparison, the 2024 cycle has only reached 273 days since the April 19, 2024 halving.
So far, each #Bitcoin cycle has lasted longer than the previous one.
2013 topped 357d post-halving
2017 topped 518d post-halving
2021 topped 546d post-halving2025’s current top was made just 273d post-halving.
Pretty sure the cycle high is yet to come. pic.twitter.com/LYYI8eCQFI
— Jelle (@CryptoJelleNL) April 8, 2025
According to the timeline, the current high was reached earlier than in previous cycles. Jelle’s analysis indicates that this deviation could mean the cycle top has not yet occurred. The chart draws attention to the 273-day point across previous cycles, showing that price increases followed that move. Historical patterns suggest that further price activity is likely beyond this point.
Technical Support at 38.2% Fibonacci Level
Another technical view from Titan of Crypto identifies a key support point at the 38.2% Fibonacci retracement level. His chart shows Bitcoin retesting the $73,741 area, which has served as support in prior bull market corrections. He indicates that the level remains intact if the price closes above it and even if a wick is underneath during the day.
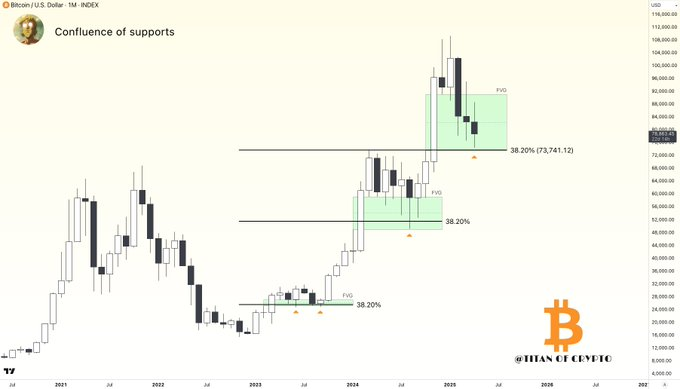
Source: X
Titan’s chart also points to completing Fair Value Gaps (FVGs) in the same zone. These gaps represent regions where the price tends to return before continuing its direction, and the recent fill may indicate a possible turning point. Past market cycles have shown strong rebounds from similar setups when FVGs align with key Fibonacci levels.
Outlook Ahead of Potential Breakout
Bitcoin continues trading near $80,000, and analysts are now waiting for a direction to form. Thus, as expected, the daily price has bounced higher from $78,200, with higher lows afterward. Despite lower trading volume, the structure points to sustained bullish sentiment.
With the target area of the halving cycle at 273 days hit and with the help of the technical and historical data obtained from this research, one can only assume that there might be a further increase in the following month.


 Surge to $85,000 Possible as Long-Term Holders Ramp Up Accumulation")


