- Bitcoin is trading above $94,000 and seems determined to defy bearish divergence and multiple sell signals.
- On-chain data looks strong, with active addresses increasing and exchange reserves decreasing.
- Technical support has been holding, and Bitcoin has re-anchored on the 200-day MA, opening up further upside in the crypto.
Bitcoin maintains above $94,000 even with visible bearish signs. Ali Martinez flagged a bearish divergence on the 4-hour chart between Bitcoin’s price and the Relative Strength Index (RSI), warning that the TD Sequential indicator has flashed multiple sell signals. The divergence indicates that the upward price momentum is slowing down despite the bullish pattern that has recently arisen.
Source:X
Bitcoin’s trading volume rose to $38.49 billion, a 16.49% increase, reflecting higher buying and selling activity. In the last 24 hours, Bitcoin went up by 3% and is now trading at $94,800. However, the emerging divergence warns traders that there may be pullbacks or trend reversals soon.
On-Chain Metrics Signal Underlying Strength
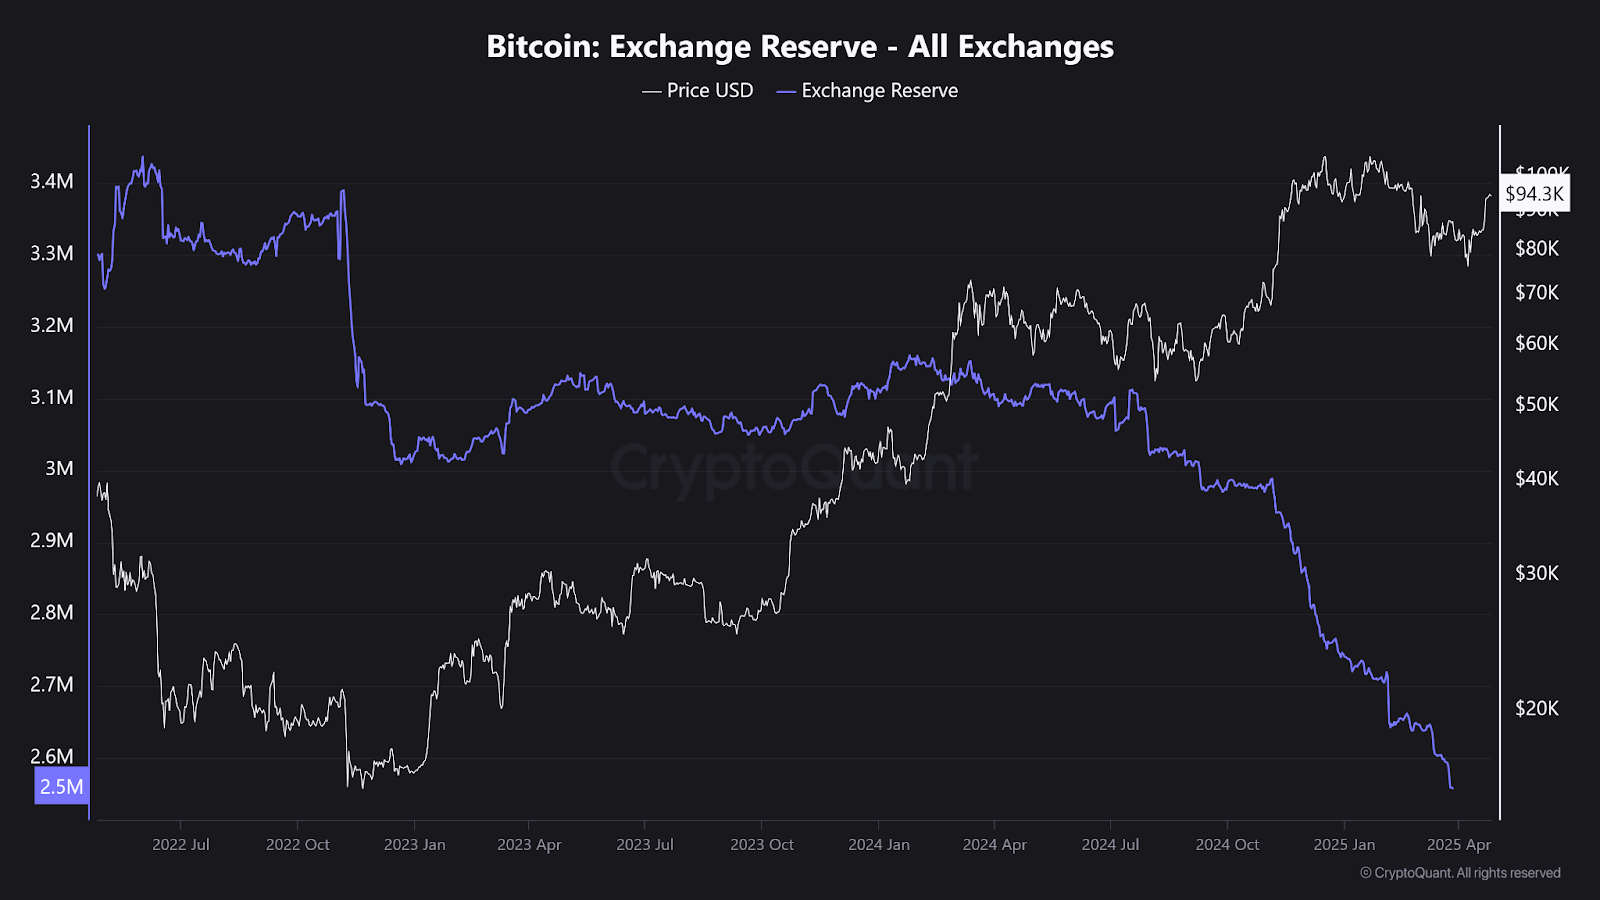
On-chain data paints a much better picture. Data from CryptoQuant shows that the exchange reserve is decreasing and is currently at a level of 2.5 million BTC, which is the lowest level in years. Furthermore, consistent outflows to exchanges suggest that users prefer to transfer Bitcoin to their cold storage wallets, supporting long-term bullish sentiment.

Source: CryptoQuant
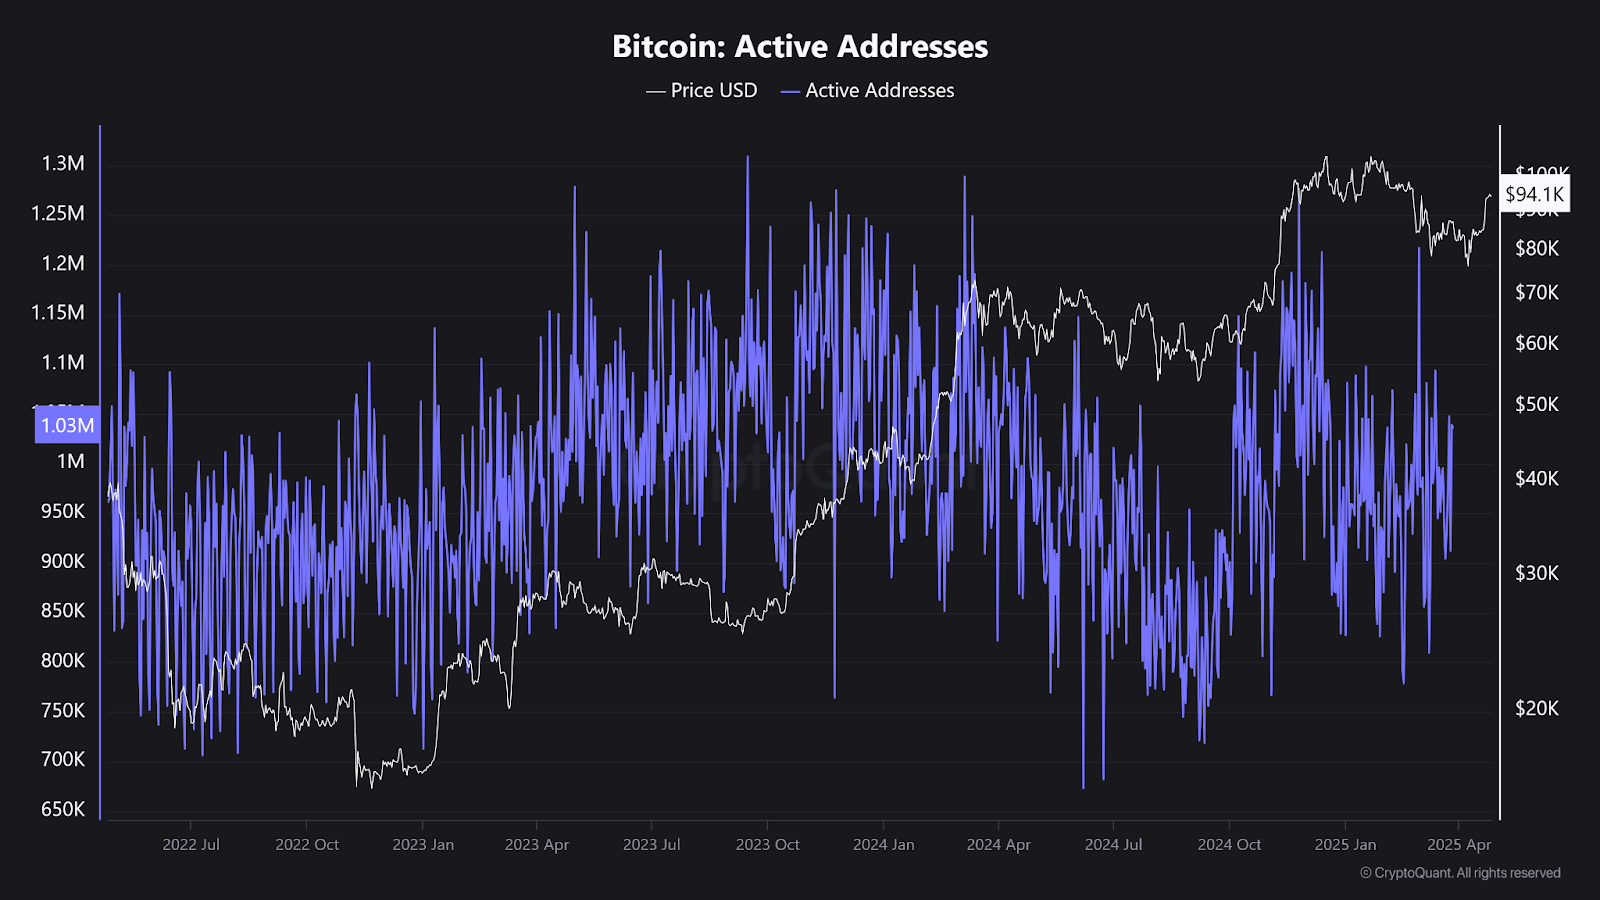
Furthermore, the number of active addresses in Bitcoin has remained high. The current figures are at 1.03 million active addresses, suggesting strong activity of the network. Historically, active address counts increasing or remaining stable correlate with rising or stable prices, including during periods of volatility.

Source: CryptoQuant
In line with this, according to Coinglass, the BTC spot outflow remains higher than the inflow, and recently, the net sessions reported negative figures. These outflows increase the confidence of investors as the coins are moved from the exchanges to storage wallets to alleviate pressure on the exchange.
Key Technical Levels in Focus After Critical Moving Average Reclaim
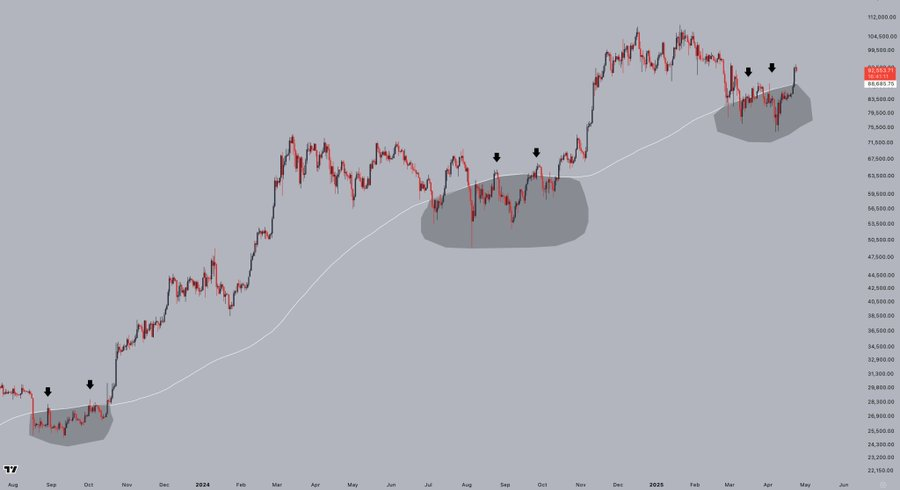
Although there is a need for short-term bearish approaches, most technical indicators point to the ability to continue with upward movements. CryptoJelleNL also noted that Bitcoin bounced back to the cryptic 200-MA for the third time in the current cycle. As per historical trends, once Bitcoin crosses this moving average, it is more likely to consolidate above it for an extended period.

Source: X
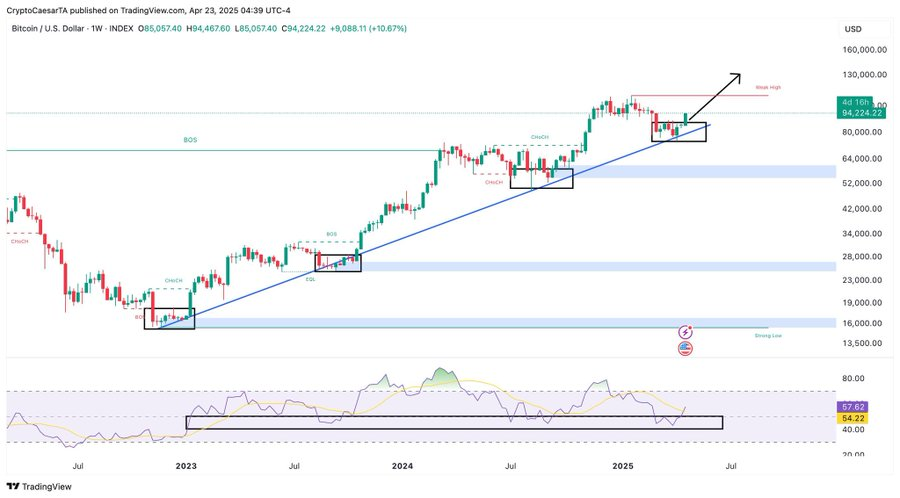
Crypto Caesar has also said that Bitcoin recently responded to a key support level, showing good indicators. His analysis also points to higher targets if Bitcoin manages to continue rallying past the support levels.

Source: X
Additional evidence of bullish prospects is another chart, which shows an upward trend, with constant booms after consolidations. Bitcoin, which has been trading inside the pennant formation in a bullish trend, has been forming higher lows and higher highs. However, traders must be wary in the short term despite these moves.


