


- Aptos price is extending its gains on Thursday after breaking above the falling wedge pattern the previous day.
- Mereo announced a strategic partnership with APT to enhance K-Pop fan experiences.
- Coinglass’ long-to-short ratio for APT reached its highest in over a month, indicating more traders are betting for a rally.
Aptos (APT) price extends its gain by 4%, trading around $6.56 on Thursday after breaking above the falling wedge pattern the previous day. Mereo announces strategic partnership with APT to enhance K-Pop fan experiences, further projecting the platform’s bullish outlook. Moreover, Coinglass APT’s long-to-short ratio reached its highest level in over a month, indicating more traders are betting for APT to rally.
Mereo chose Aptos to power K-pop fandom
Mereo, a social engagement stack that engages and identifies true fans, chose the Aptos blockchain network to enhance K-Pop fan experiences.
“Aptos delivers the speed, security, and scalability Mereo needs to elevate artist-fan rewards for millions of K-Pop fans worldwide,” said Aptos in its X post on Wednesday.
Collaborations, such as with Mereo to enhance K-Pop fan experiences, highlight Aptos’ versatility and appeal across different sectors.
Mereo chose Aptos to power the future of fandom. First stop? K-Pop.
Aptos delivers the speed, security, and scalability Mereo needs to elevate artist-fan rewards for millions of K-Pop fans worldwide.
Now, Web3 and K-Pop stans have another reason to sing apateu, apateu…
— Aptos (@Aptos) February 19, 2025
Aptos Price outlook: APT breaks above the falling wedge pattern
Aptos price broke above the falling wedge pattern formed by connecting multiple high and low levels with a trendline from late November on Wednesday and rallied 12.23%. At the time of writing on Thursday, it continues to rally by 4%, trading around $6.56.
If APT continues its upward momentum, it could extend the rally by 18% from its current trading levels to retest its next daily resistance at $7.74.
The Relative Strength Index (RSI) on the daily chart reads 48, bouncing off its oversold level of 30 on Tuesday, indicating mild strength in bullish momentum. For the bullish momentum to be sustained, the RSI must trade above its neutral level of 50 for the rally to continue.
The Moving Average Convergence Divergence (MACD) indicator, which shows a bullish crossover on the daily chart, further supports Aptos’ bullish outlook. The MACD line (blue line) trades above the signal line (yellow line), suggesting the bulls are buying. Additionally, it shows rising green histogram bars above its neutral line zero, indicating bullish momentum.
APT/USDT daily chart
Another bullish sign is Coinglass’ APT long-to-short ratio, which reads 1.20, the highest level in over a month. This ratio above one reflects bullish sentiment in the markets as more traders are betting for the asset price to rise.
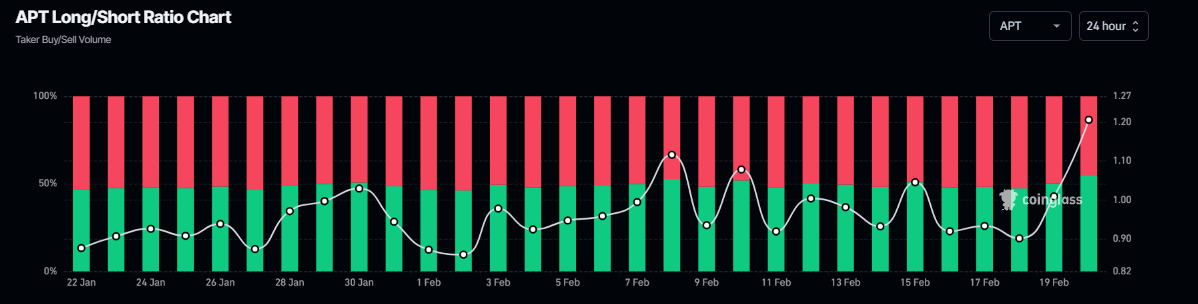
APT long-to-short ratio chart. Source: Coinglass


