 Price Bulls Take Control Amid Short Liquidations")


 Price Bulls Take Control Amid Short Liquidations")
Stellar (XLM) price is capturing trader attention as bullish momentum builds following a sharp price rally and rising market activity. A classic inverse head and shoulders pattern is forming on the 4-hour chart, pointing to a possible trend reversal.
With short liquidations surging and volume climbing, bulls appear to be gaining control. If support holds, XLM may be on the verge of a breakout above key resistance levels.
Bullish Pattern Develops on XLM Price Chart
Stellar (XLM) is trading at $0.2967 after peaking above $0.305 and dipping to $0.2735 earlier in the day, reflecting strong intraday bullish momentum. The price is up over 8%, supported by a 190.74% surge in trading volume to $473.9 million. Market cap has climbed to $9.19 billion, with a fully diluted valuation of $14.83 billion. XLM’s circulating supply stands at 30.98 billion out of 50 billion total.
Technically, XLM’s 4-hour price chart shows an inverse head and shoulders pattern forming, often signaling a bullish reversal. The neckline between $0.28 and $0.29 serves as a key resistance zone.
Source: CoinMarketCap
A breakout above this neckline could propel prices toward Fibonacci extension targets of $0.324, $0.341, and $0.368, with a longer-term aim near $0.390. The combination of a bullish pattern, rising volume, and strong market interest suggests continued upside potential if confirmation occurs.
Liquidation Data Shows Short Traders Hit Hard
Data from Coinglass shows that short positions are being closed rapidly as prices rise. On May 8–9, short liquidations rose, with traders covering their positions as XLM moved past $0.30. The liquidation chart shows a balanced derivatives market with bursts of volatility tied to price spikes.
The largest long liquidations occurred on April 6–7, reaching $931,500, following a sudden dip in XLM’s price. On April 9, a sharp rise in price caused a wave of short liquidations. Since mid-April, liquidation numbers were stable until early May, when another wave of short closures occurred.
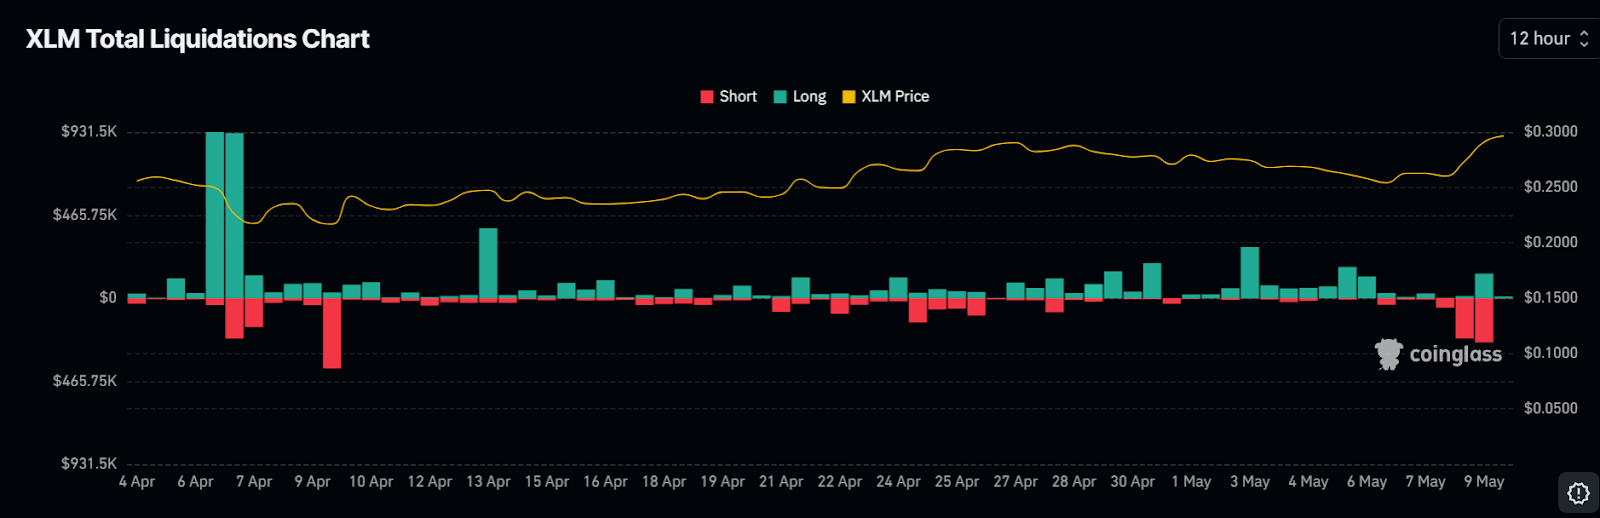
Source: CoinGlass
Recent short touching highlights that traders were ill prepared for the most recent bullish move. This reduction in these positions has created more buying pressure along the way to drive the price even higher.
Derivatives Metrics Indicate Rising Trader Commitment
The stellar derivative market is witnessing an alarming growth rate in activities. Open interest increased by 27.64% to $189.67 million, showing that more traders are entering positions. At the same time, trading volume surged 225.82% to $413.17 million over 24 hours.
The long/short ratio shows a slight bullish preference at 1.0379. On Binance, it stands at 1.7226, and on OKX, it is 1.58. This is an indication of increased traders hoping the price will increase. In addition, top traders prefer long positions where Binance accounts have a ratio of 1.7137 and position based data 1.1061.
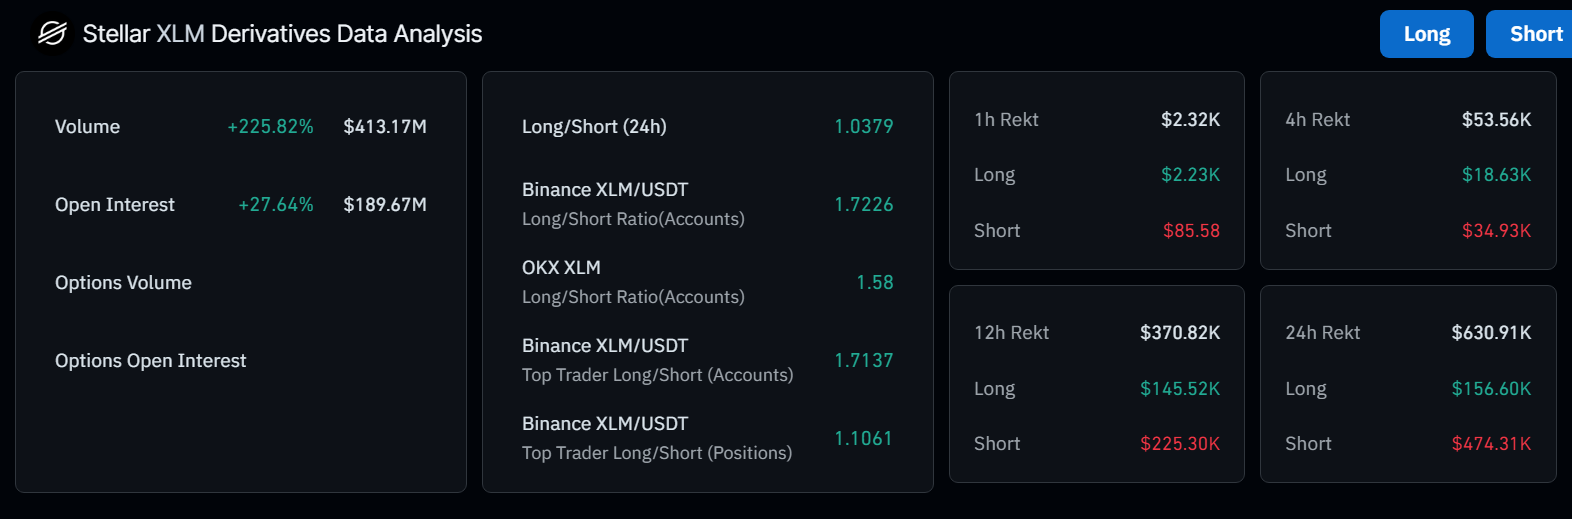
Source: CoinGlass
The total liquidations in the past 24hrs amounted to $630,910. From this sum $474,310 were derived from short positions.. This data supports the view that rising XLM prices are catching short sellers off guard.
Key Support Levels Hold While XLM Price Breakout Nears
According to crypto analyst Ali Martinez, XLM’s price is near the end of its inverse head and shoulders pattern. He pointed out that if the support at $0.24 holds, the right shoulder can form soon. From there the price may breakout above the neckline and head towards new levels.
Both Fibonacci retracement levels at $0.255 (0.618) and $0.273 (0.786) can become short term support during pullbacks. He shared that market sentiment remains optimistic as traders wait for a confirmed breakout.
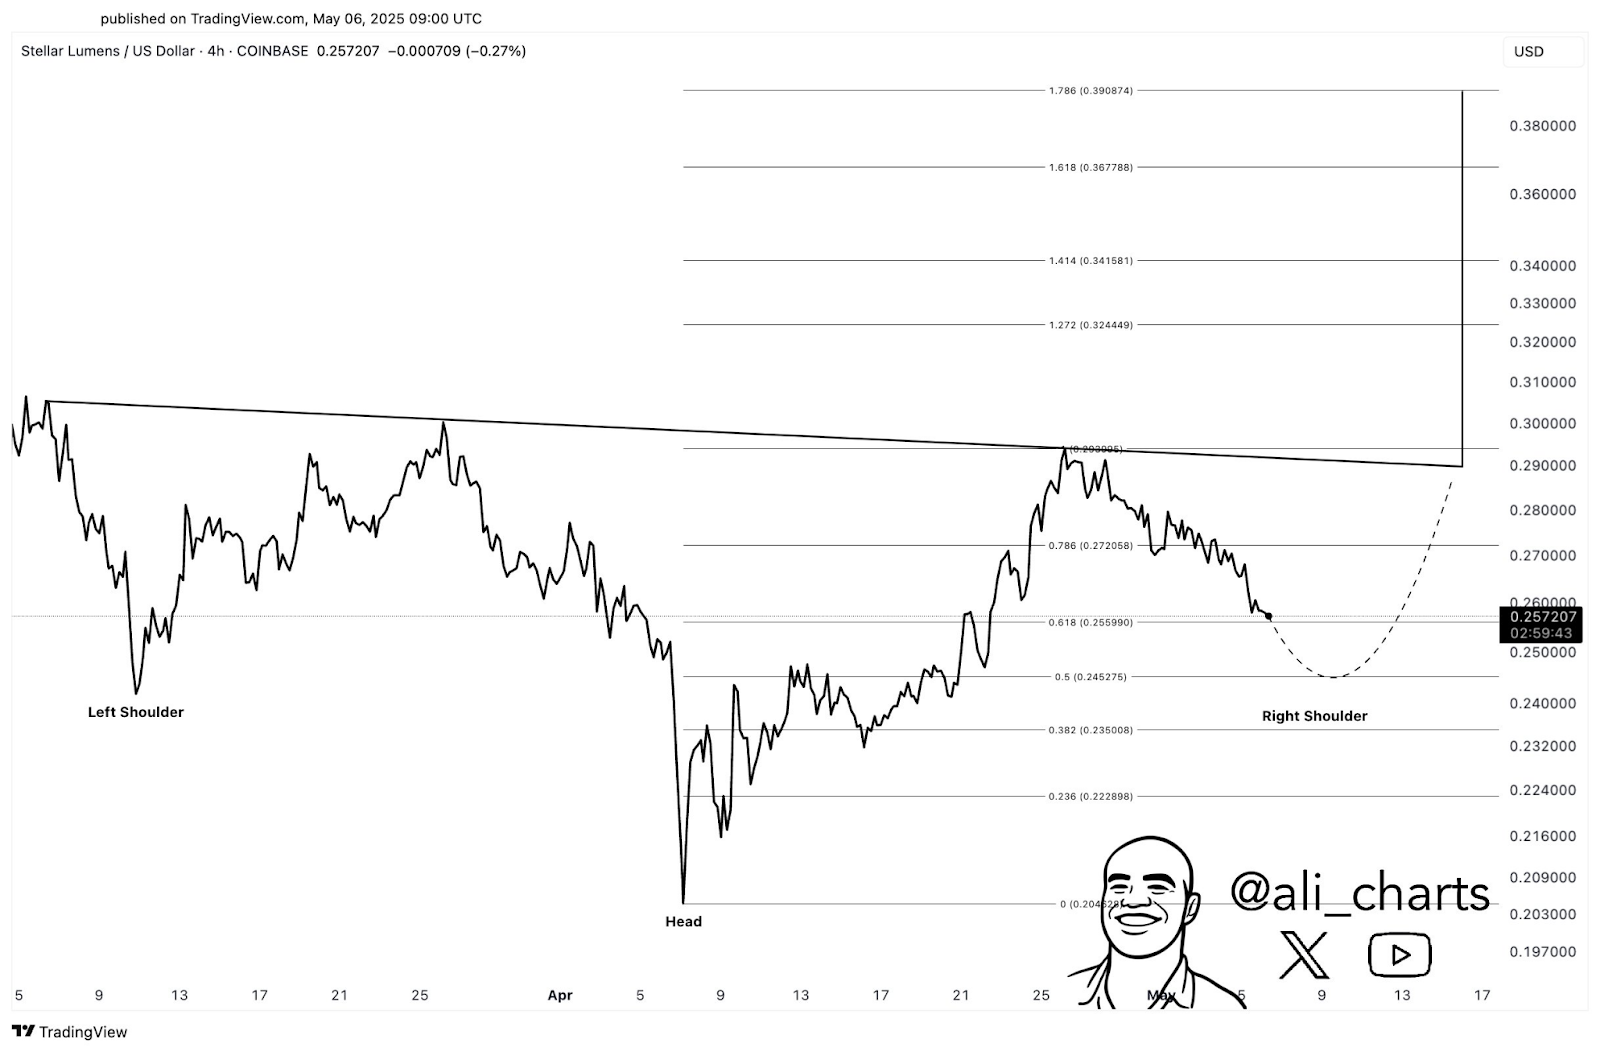
Source: X
As of now, technical and derivatives data suggest that bulls are in control. The steady volume increase, together with rising open interest and short liquidations, supports the current uptrend. If XLM’s prices remain above key support levels, a move beyond $0.30 could open the path toward the $0.324 to $0.390 zone in the coming days.


 Price Eyes $106K, Saylor Blames Short-Term Holders for Delay to $150K")


 Price Targets $4,000 After Breaking Key Resistance Levels")