


The cryptocurrency market is experiencing optimism as Bitcoin is holding at about $83,000, potentially igniting a bullish recovery across altcoins. Chainlink (LINK) is currently trading at $13.004, showing a slight gain of 0.42% in the last 24 hours.
With a falling wedge pattern formation on the daily chart, LINK is showing some signs of an upcoming trend reversal.
LINK Price Analysis
Bearish price action for LINK has been persistent since December 2024. The token has seen a decline from its December high, which stood near $30, and now has dipped to the current level of around $13.004, almost 56.65% down over the last four months.
Chainlink had been trading inside a falling wedge channel, and the price created a whole set of lower highs and lower lows. This pattern would usually suggest a sustained selling pressure.
A strong breakout above the channel at around $14.50 could initiate a rally towards higher resistance levels.
TradingView
LINK’s attempting to stabilize near the $12.676 support (0 Fib level) because of this there is a temporary relief from the continuous selling pressure. Several small bodied candles have formed near this level indicating an accumulation before the next big move.
The 0.236 Fib level at $16.605 acts as the first major hurdle, followed by the 0.382 level at $19.036. These levels will likely act as strong resistance zones if a strong upward breakout happens.
The EMAs on the chart show bearish control, with price consistently trading below the EMAs. The recent crossover between shorter EMAs confirm the ongoing downtrend. However any sustained move above the EMAs could signal a start of the trend reversal.
The RSI is currently at 40.63 below the neutral 50 line. RSI has been oscillating between 30 to 60 since February, recently showing a slight uptrend. Increase in RSI despite the ongoing consolidation hints at potential positive divergence forming.
Analyst Signals Potential Crash in LINK Prices
According to Ali Martinez, a leading Crypto Analyst, LINK is about to break a crucial trendline that’s been holding since July 2023.
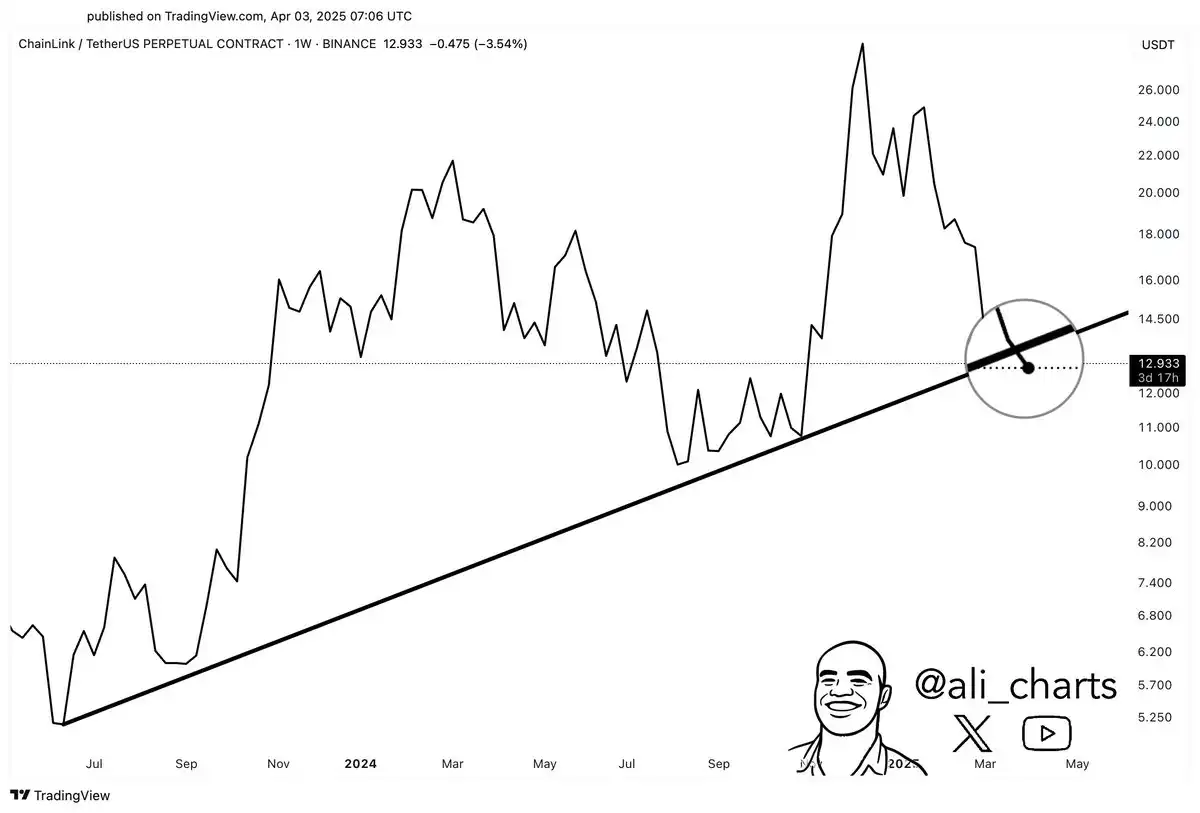

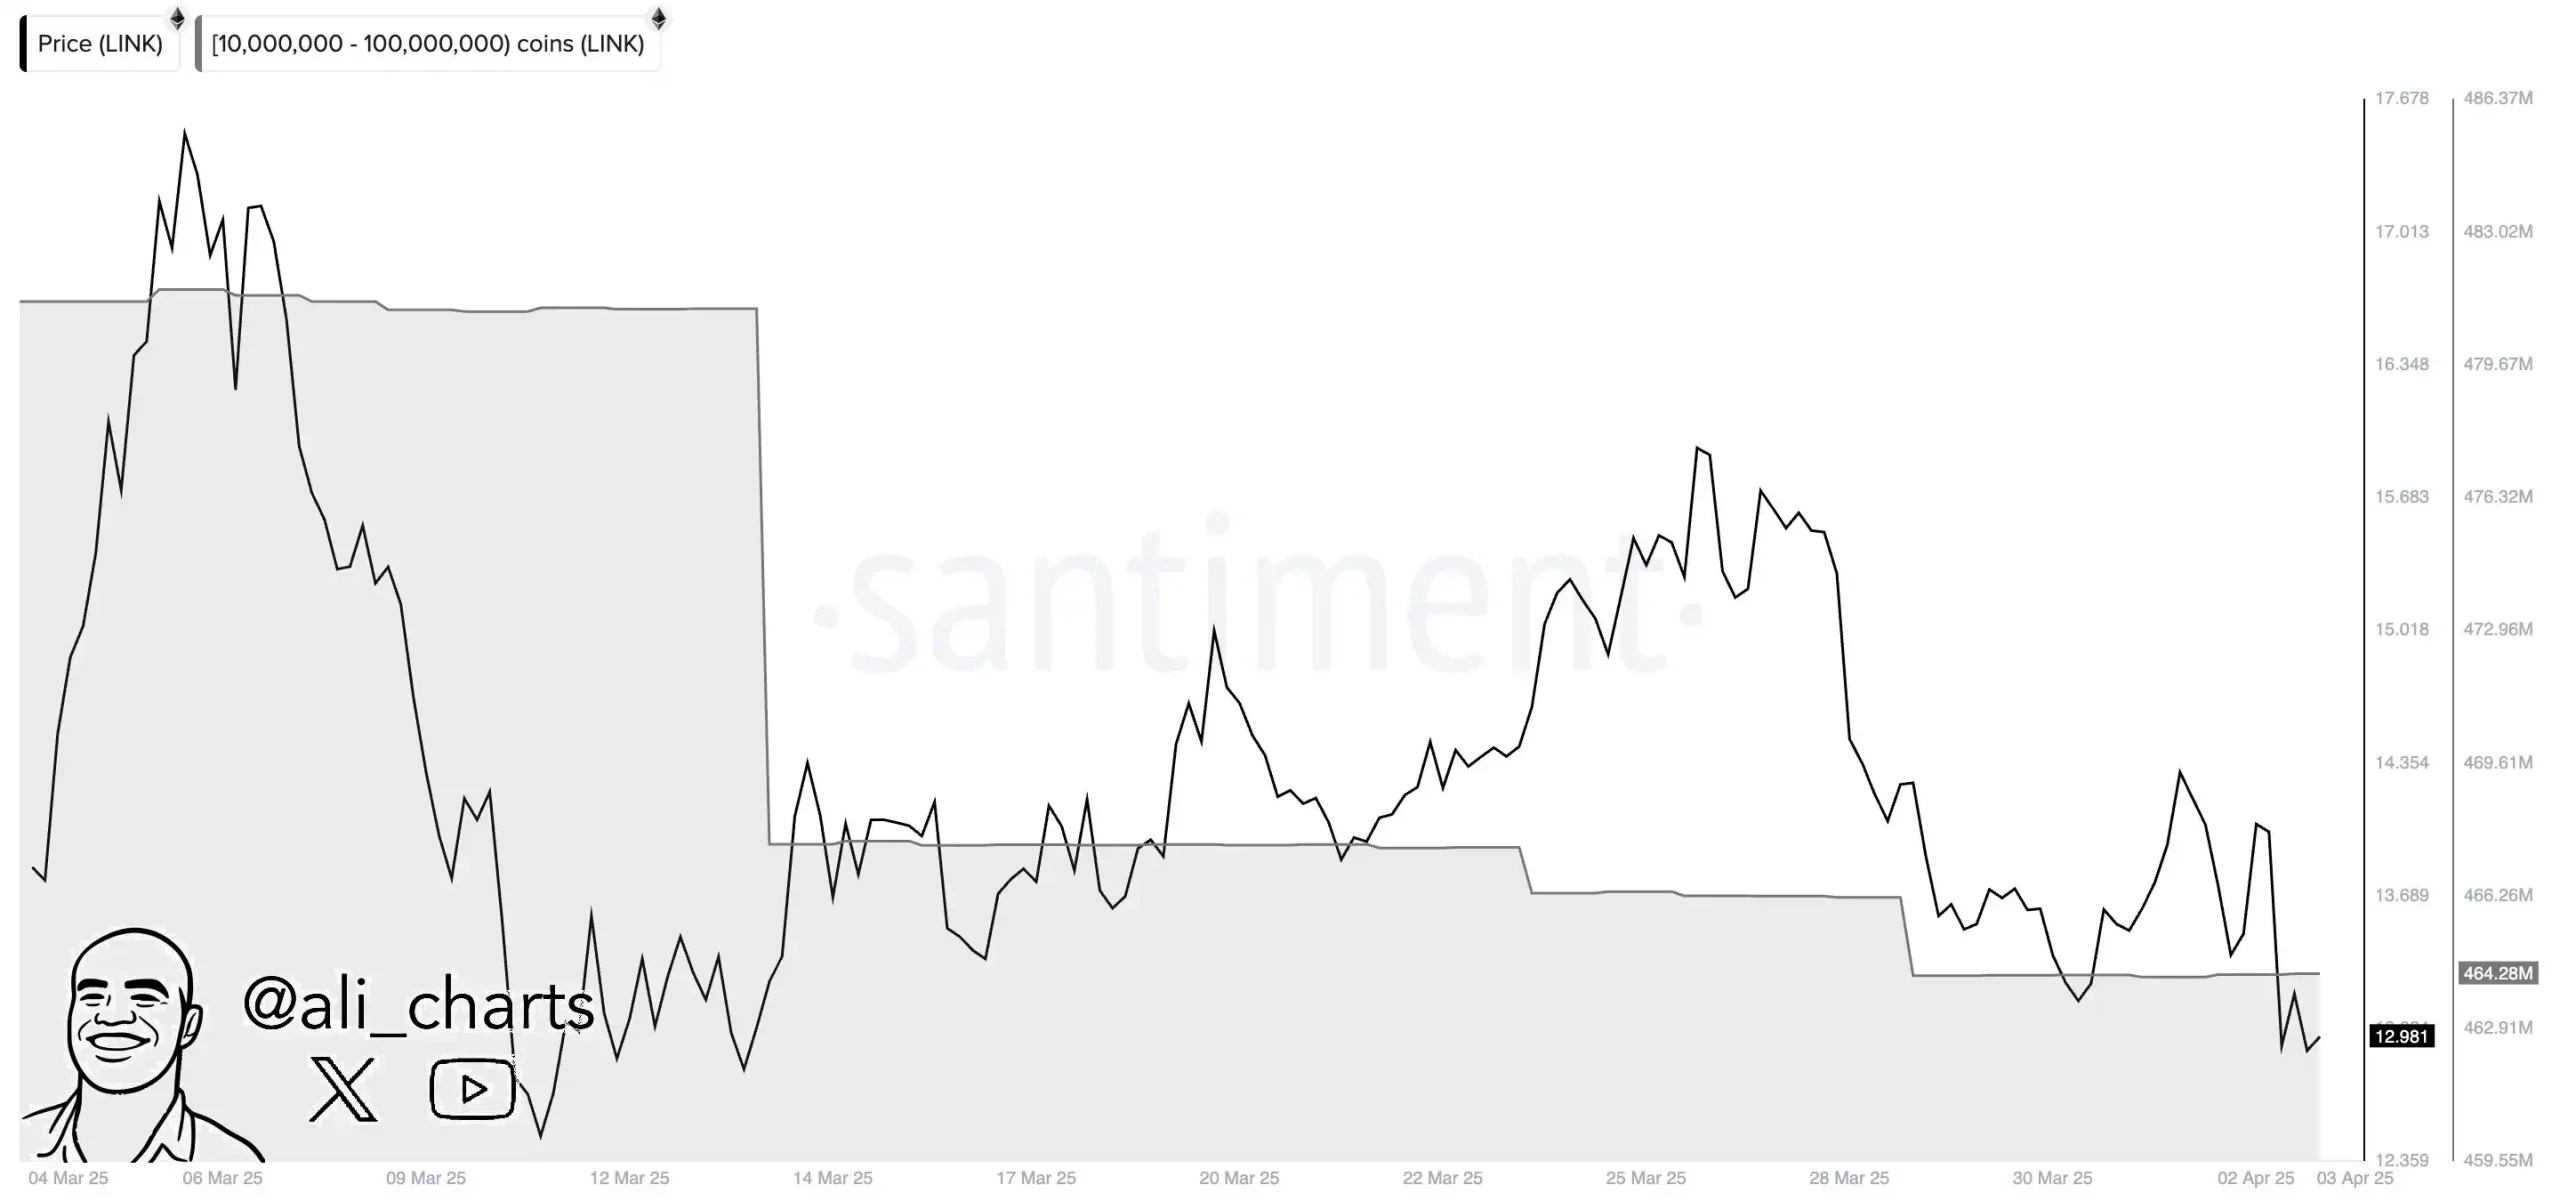
Whales sold over $170 million worth of LINK in th elast three weeks.

Breaking the $14.50 Barrier: A Path to Chainlink’s Next Price Surge?
The immediate resistance LINK now faces is at the upper boundary of the channel around $14.500. Consequently, a breakout above this level will point to the 0.236 Fibonacci level at $16.605. If bullish momentum continues strengthening, the price would go for the 0.382 Fib level at $19.036.
Immediate support at $12.676 is vital, if a break occurs, the price could go all the way down towards $10.
Price action indicates that a big move across the descending channel is about to develop. Traders need to monitor this critical layer of upper channel resistance for any significant move.
Solana And Chainlink Are Now Supported By PayPal
To strengthen its foothold in digital payments, PayPal Crypto has included Solana and Chainlink in its assets supported for U.S. customers. The move simplifies access to crypto for millions and renders a significant boost to mainstream adoption.
Fast transactions on Solana, coupled with security on ChainLink, put together payments and smart contracts. Although U.S. users can buy, sell, and hold SOL and LINK, transfer to outside wallets is still not supported.
PayPal’s continued advancement into the blockchain space may support the long-term growth of SOL and LINK, affecting market dynamics and trading activities.


