


The crypto market is on edge as Bitcoin hovers around $57,000, showing several bearish signals that could spell even more trouble ahead. With its daily 200-day moving average breached and RSI plummeting, many are questioning whether digital gold can withstand the upcoming storm. Adding fuel to the fire, the long-anticipated Mt. Gox repayments are set to begin in July, potentially releasing $8.5 billion worth of Bitcoin into an already volatile market. Will Bitcoin find its footing or tumble to new lows? Let’s dive into the data and see.
You might also like: Mt. Gox to start Bitcoin, Bitcoin Cash repayments in July
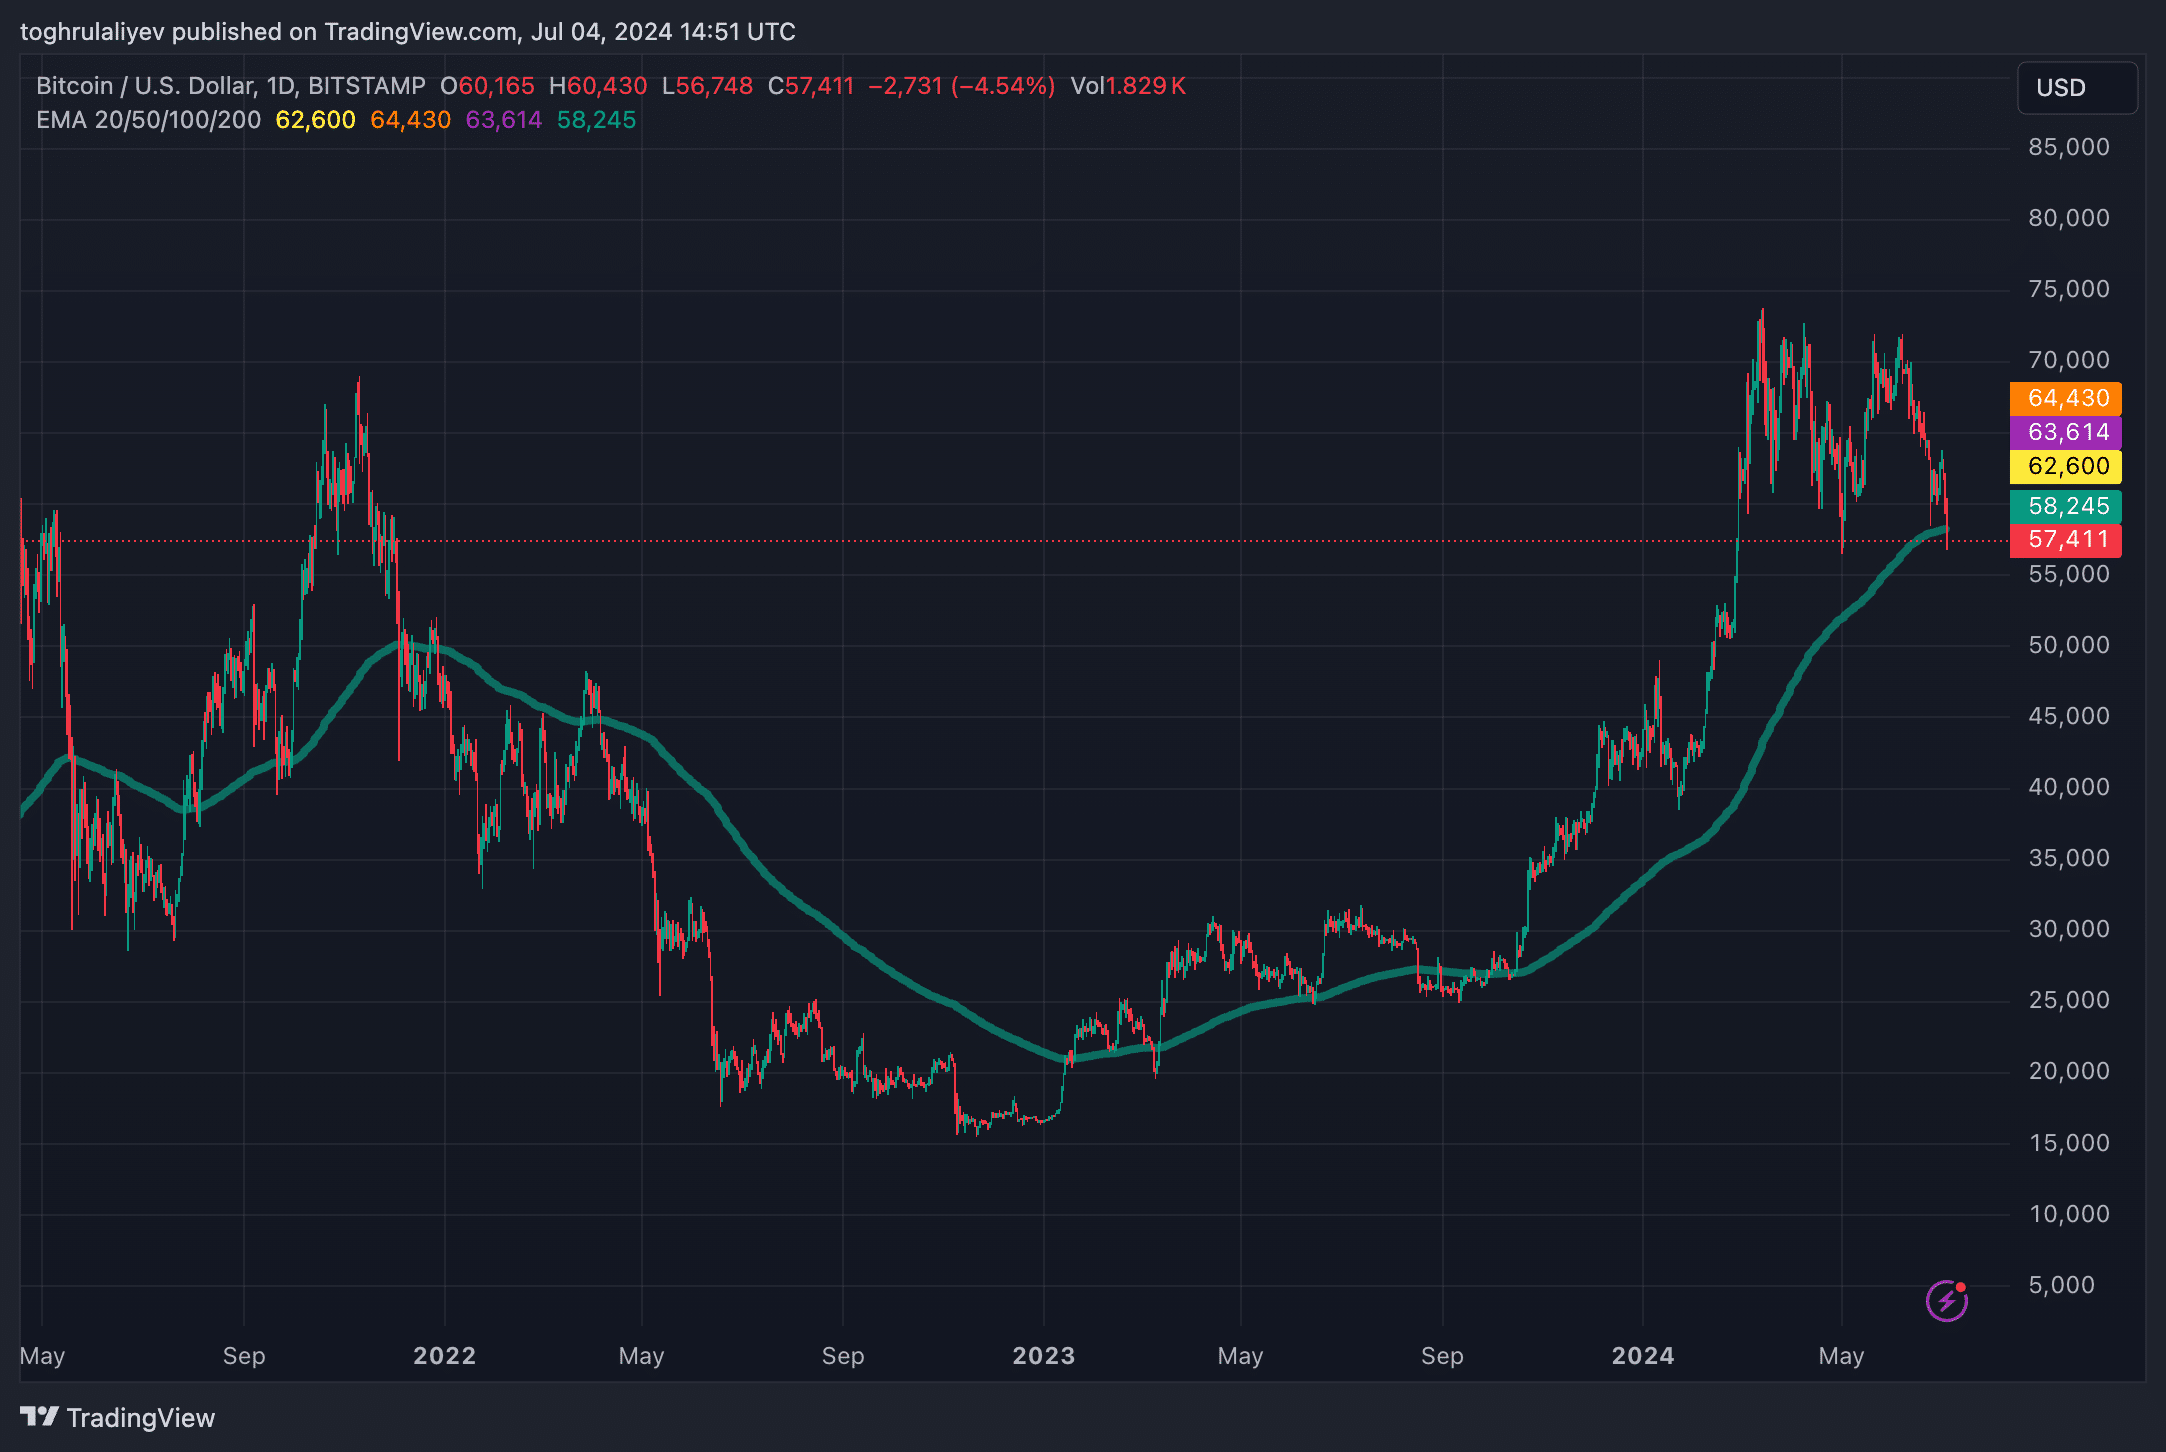
Bitcoin currently shows bearish signals, having crossed below its daily 200-day moving average (MA). The daily Relative Strength Index (RSI) at 29.79 also moved below its moving average. The scenario presents a lucrative time to invest, especially considering the historical performance of Bitcoin rebounding from such lows. Despite this, the current market conditions suggest a potential for further decline.
Notably, Bitcoin has crossed below its 200-day MA multiple times in recent history. The last instance was in June 2022, where it stayed below until March 2023, setting a low in November and then starting to move upward. Another instance occurred in August 2023, remaining below until October 2023. These patterns suggest that Bitcoin tends to stay below the 200-day MA during summer and autumn. While not a definitive indicator, this historical context can help create a strategic plan supported by other data points.

In July, Mt. Gox will start distributing around $8.5 billion worth of Bitcoin to creditors. Although CoinShares suggests this may not have a significant impact on Bitcoin’s price, the market may already be feeling some effects. In an aggressive scenario, a potential drop of 19.2% seems plausible. This aligns with our in-house analysis, indicating that Bitcoin’s price could drop to a support range between $50,856 and $51,985. This area is a confluence of multiple Fibonacci retracements and represents a macro golden pocket, indicating strong potential support. On a weekly timeframe, the 50-day moving average also aligns with that area.
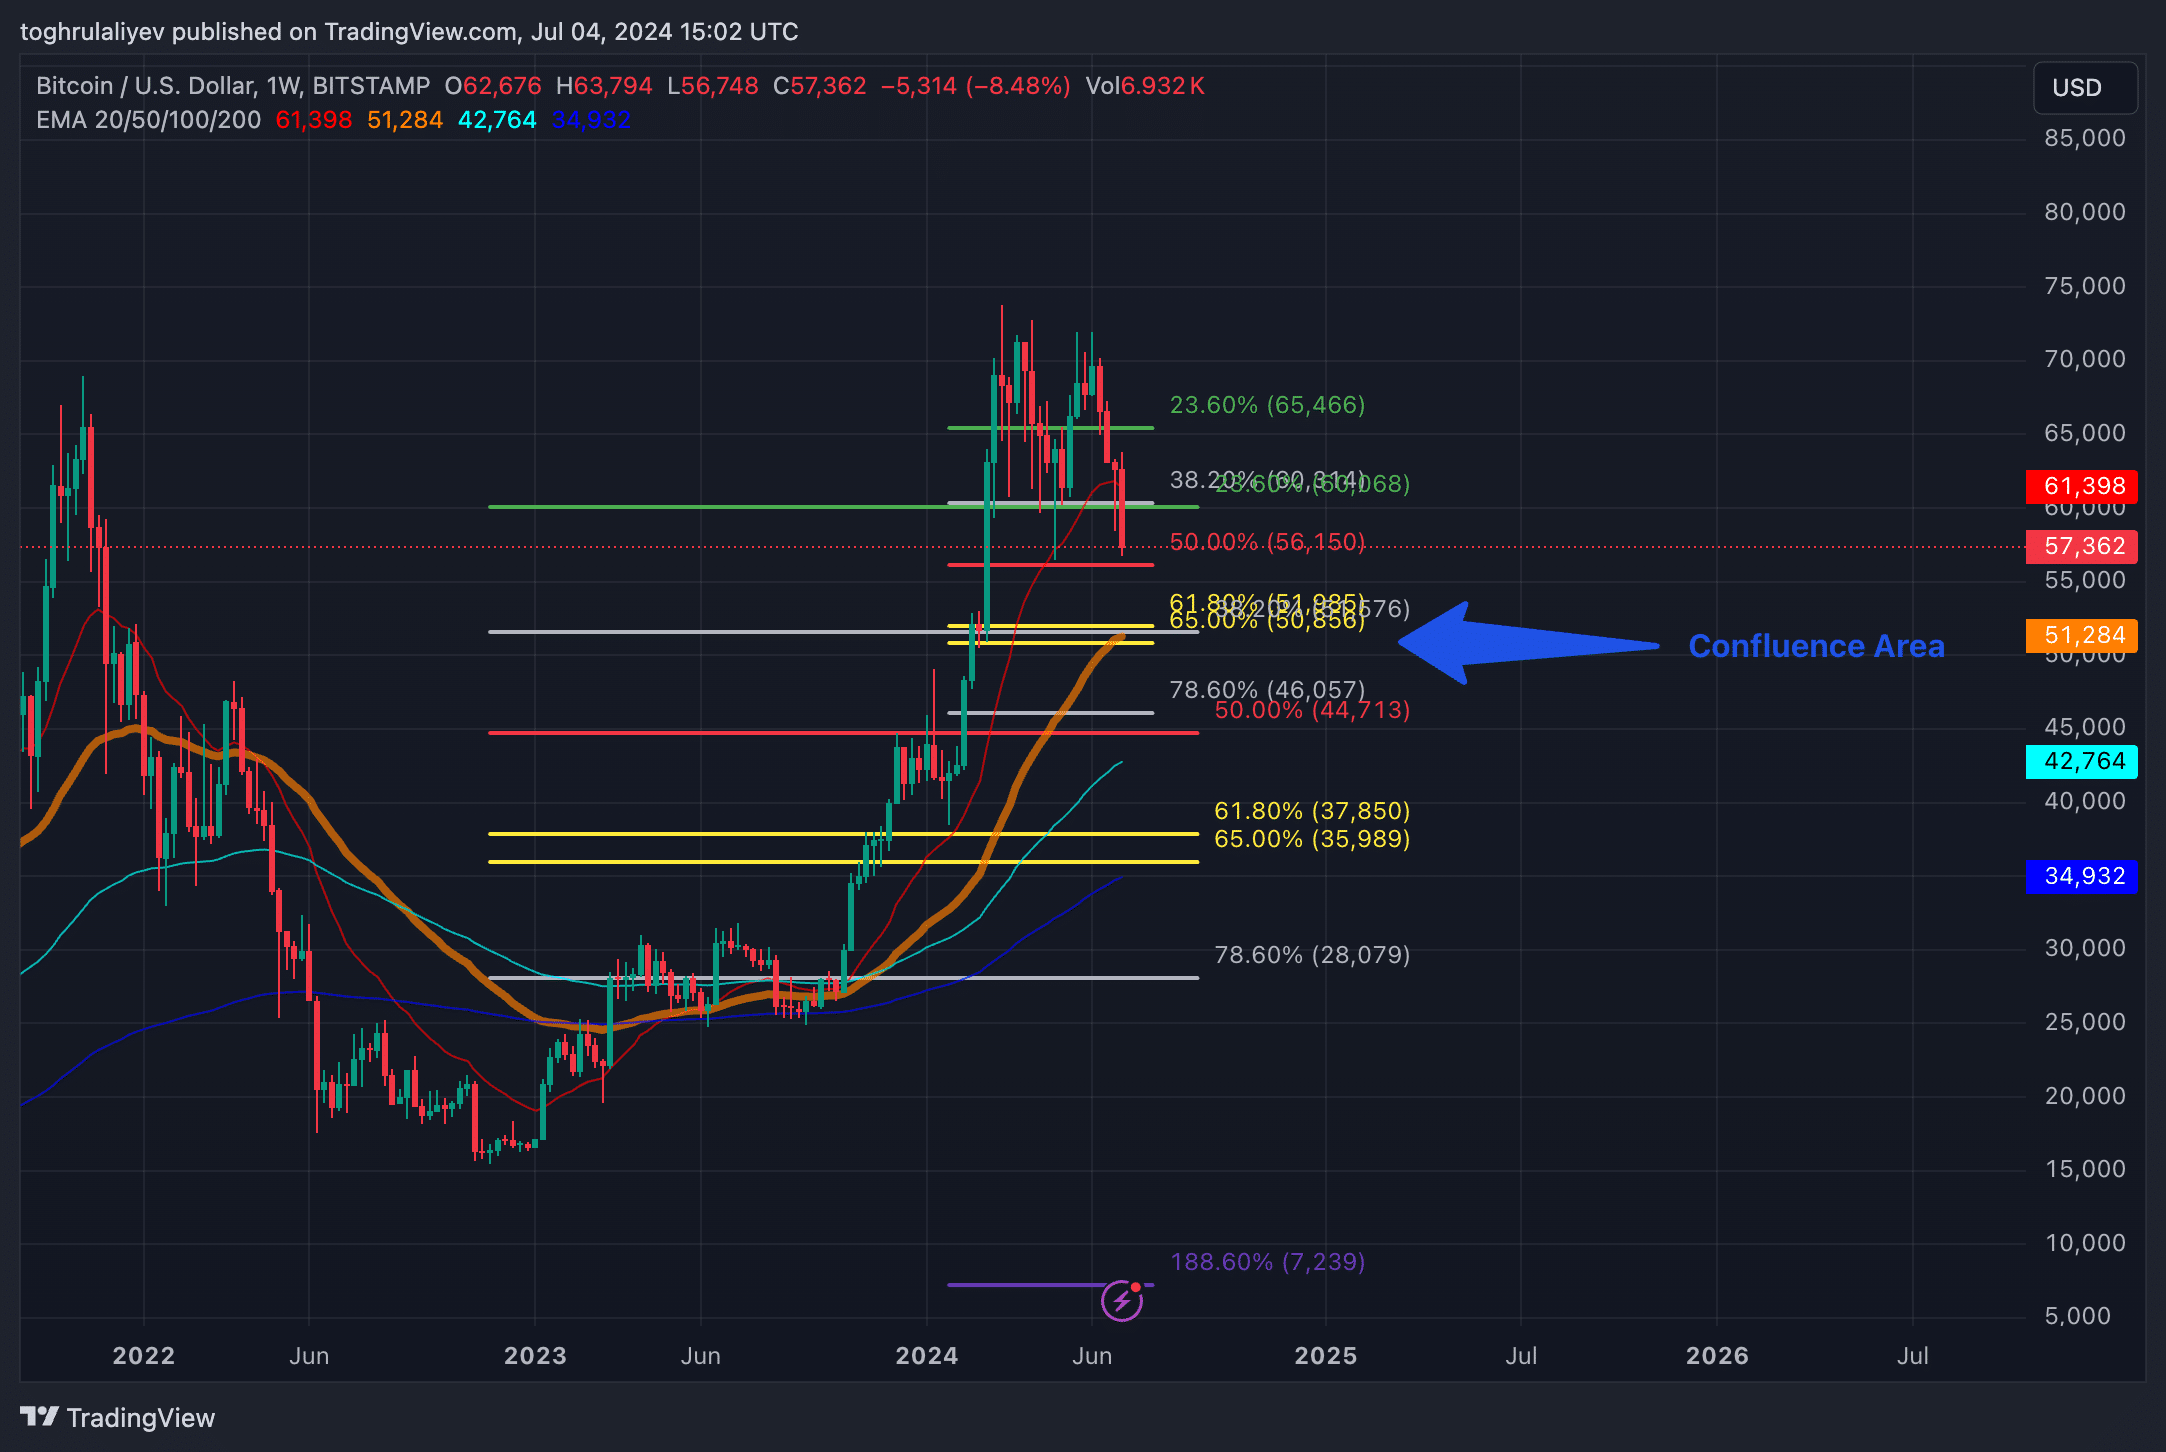
Another aspect to consider is that there are no potential support levels until this golden pocket, reinforcing the likelihood that Bitcoin could indeed drop to these levels. However, more data supports this outlook.
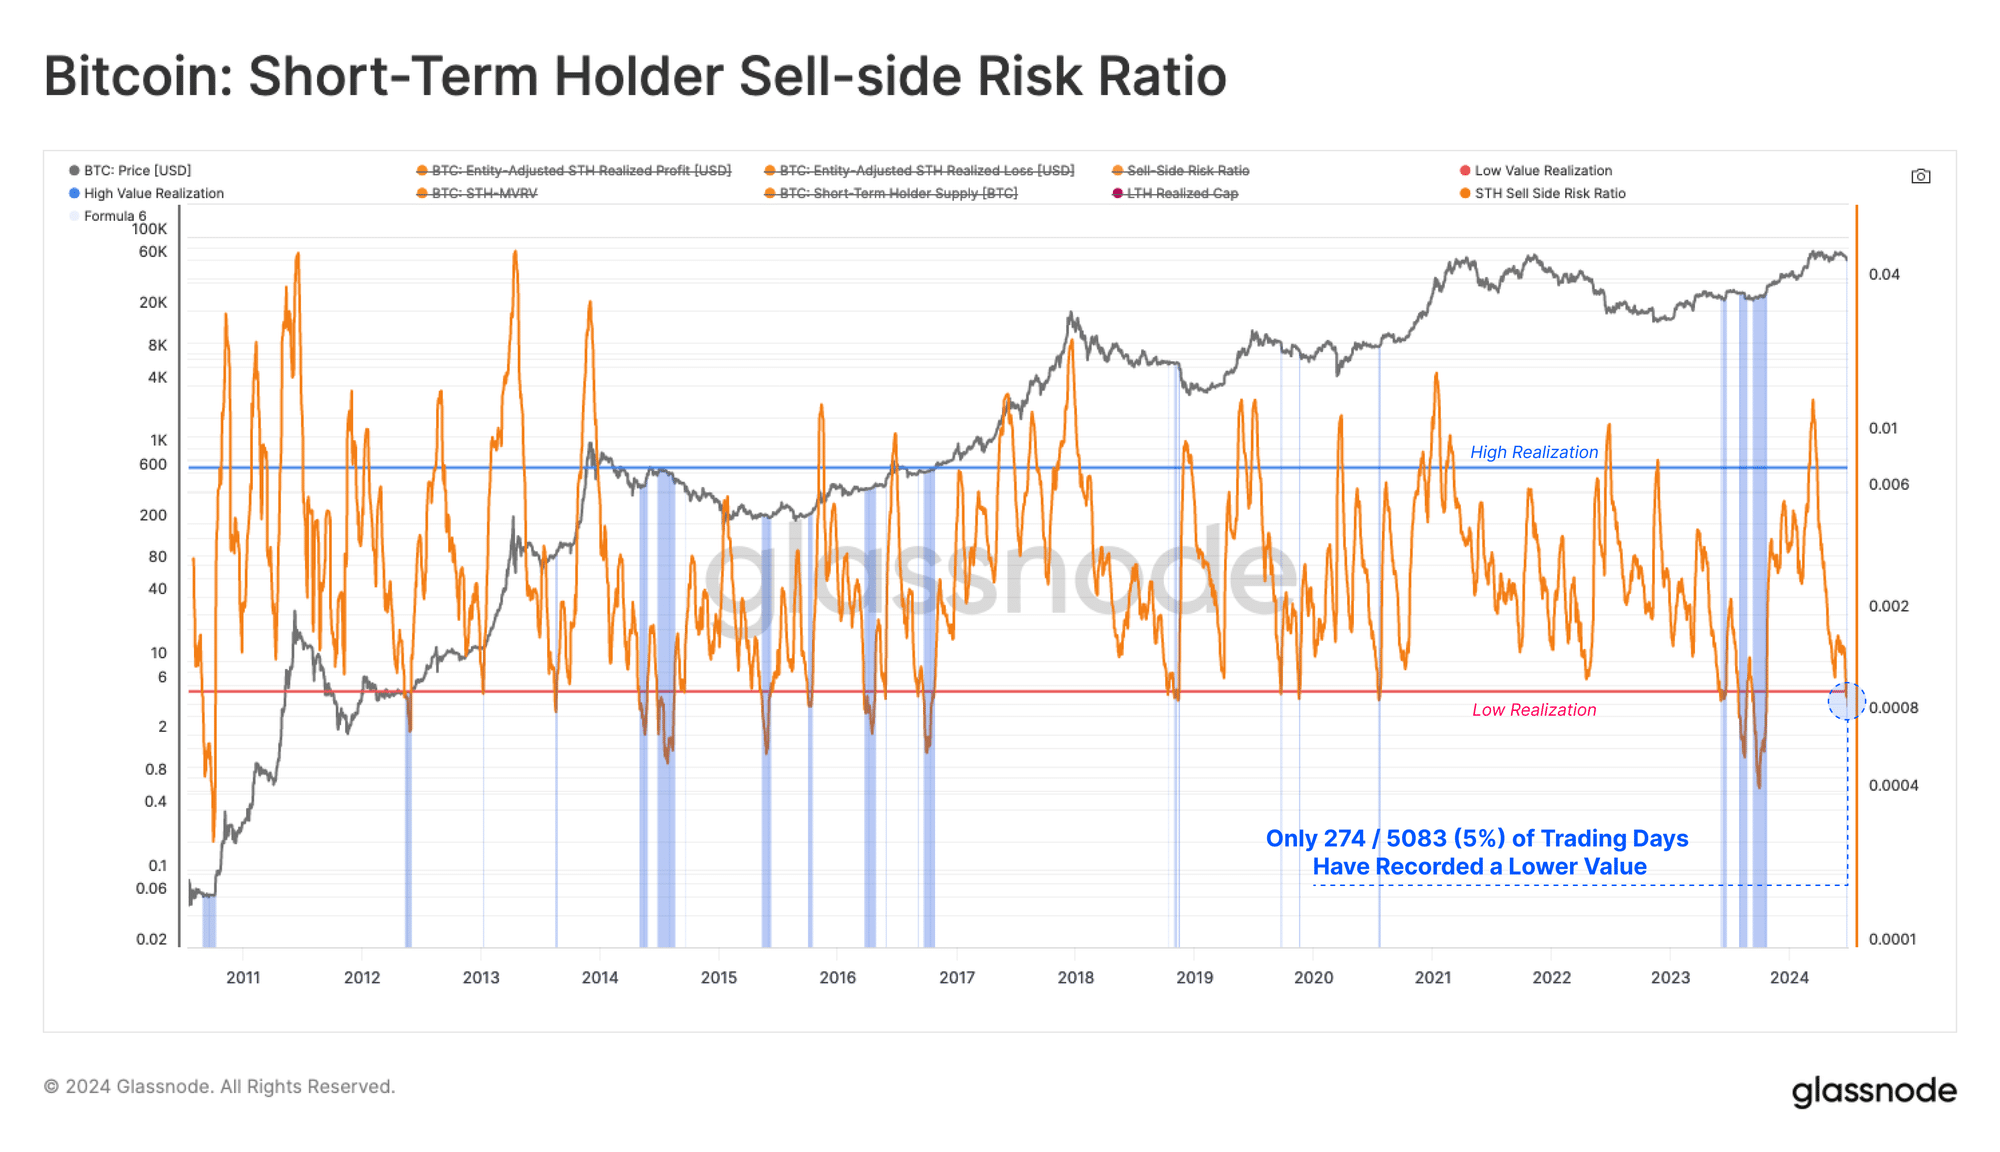
For instance, Glassnode’s Sell-Side Risk Ratio provides additional insights into potential volatility. This metric measures realized profit and loss relative to the asset size, indicating market equilibrium or the need for re-equilibration. High values suggest significant profits or losses, often followed by high volatility, while low values suggest market stability. Currently, the Sell-Side Risk Ratio is at historic lows, indicating an equilibrium and hinting at potential volatility ahead.

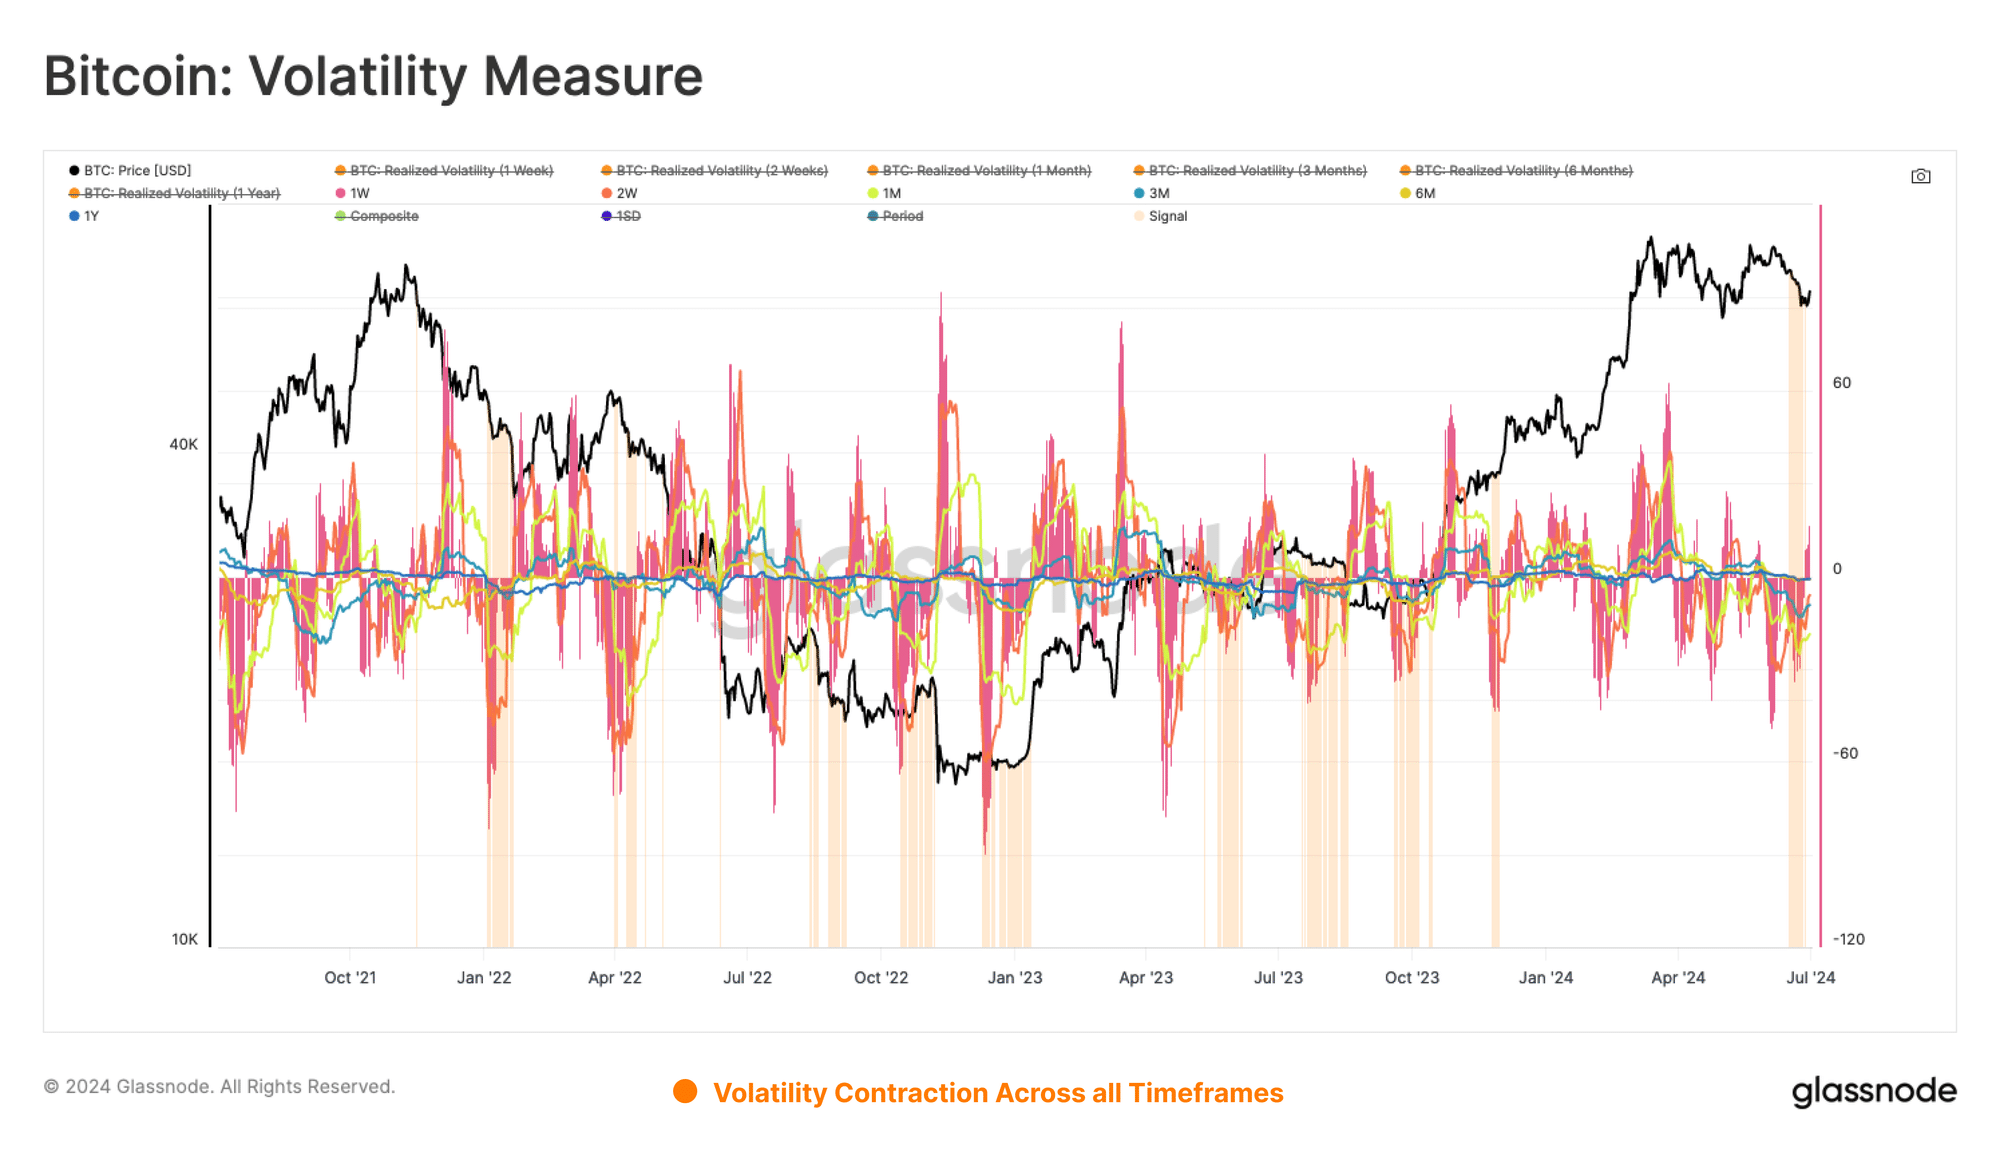
Volatility expectations are also heightened. The model assessing the 30-day change in realized volatility across various timeframes shows a marked decline, suggesting compression and future heightened volatility.
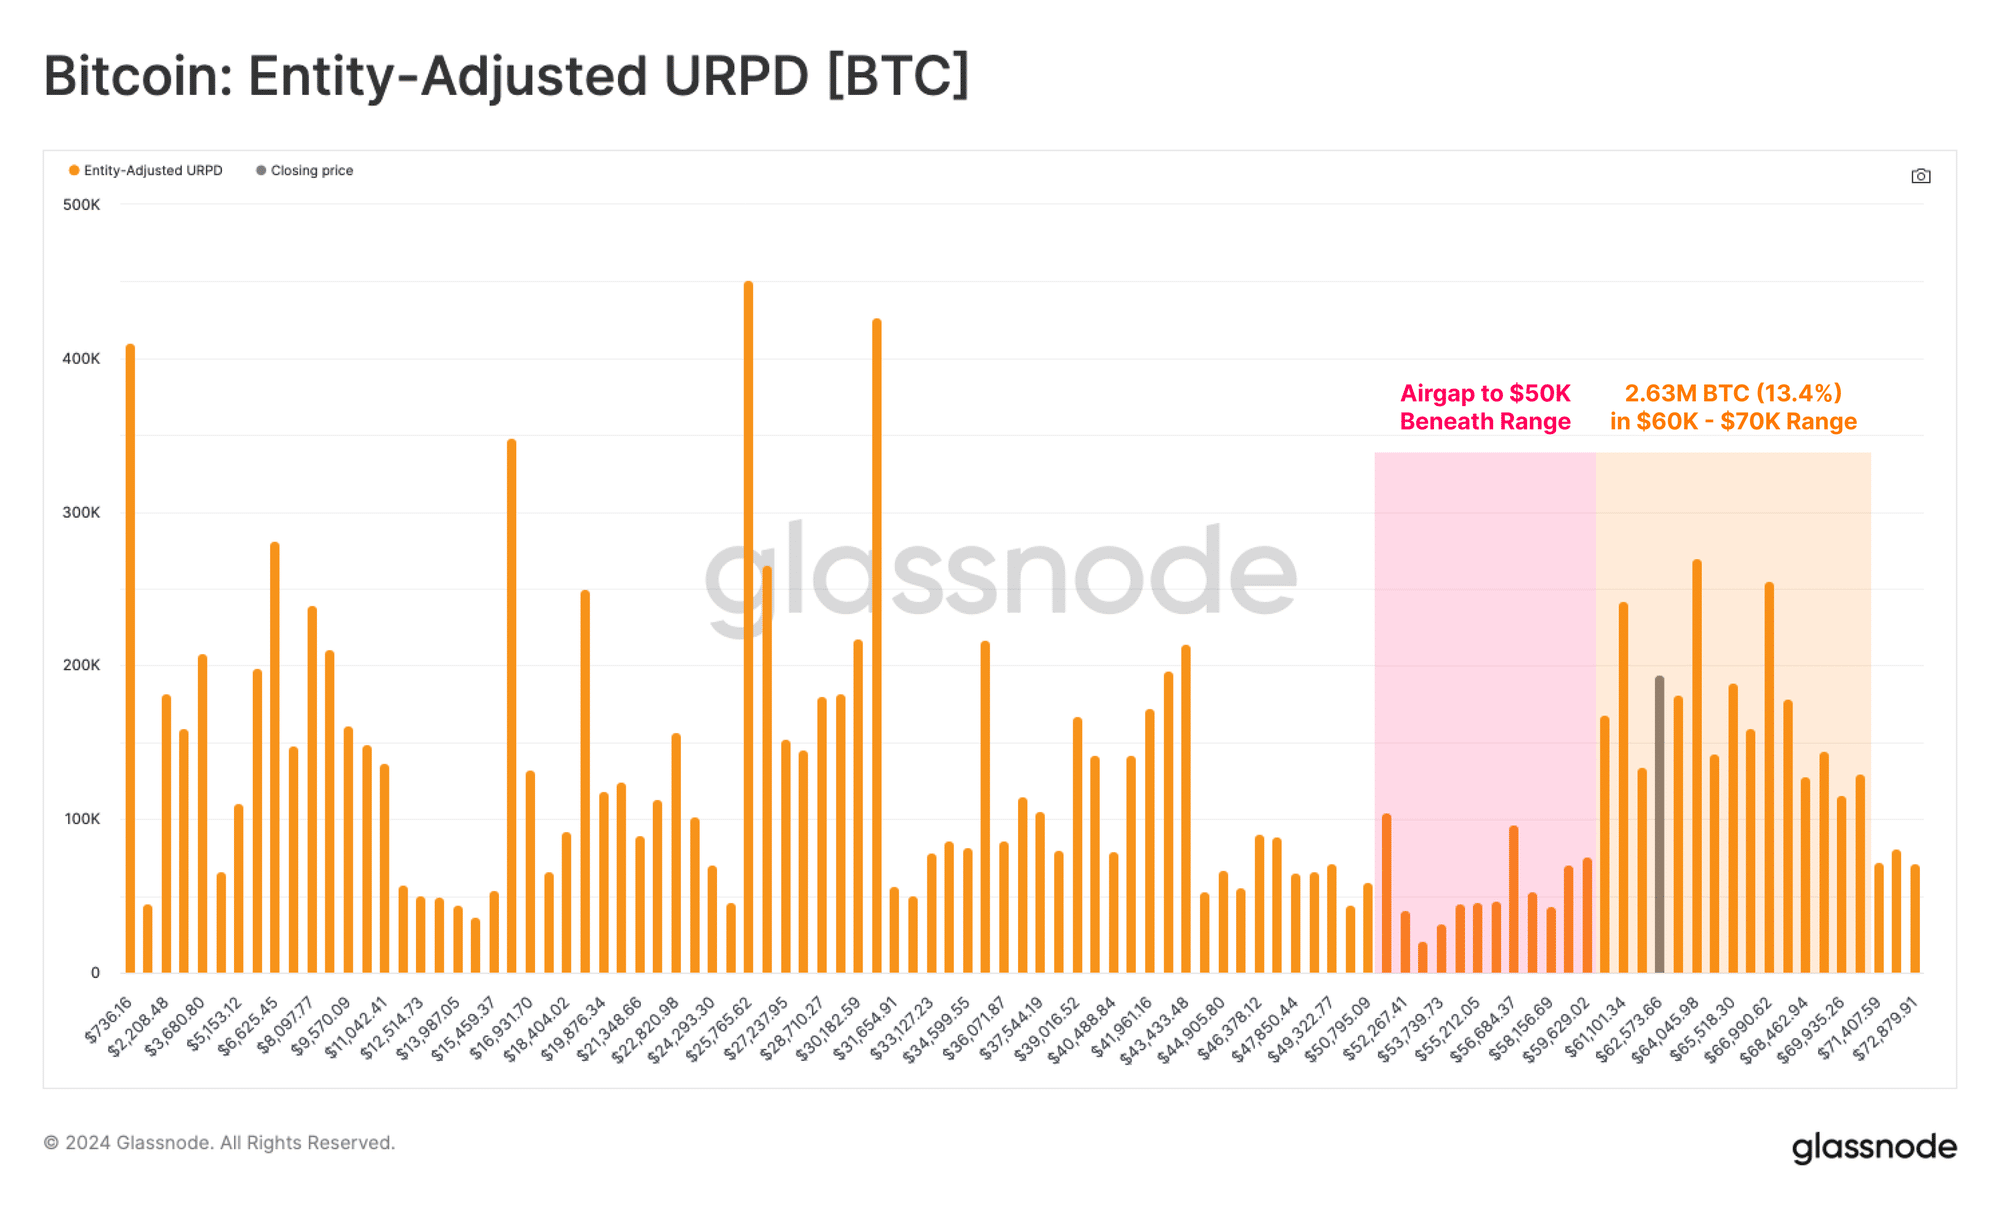
Moreover, the URPD metric highlights supply concentrations around specific cost-basis clusters. The current spot price is near the lower bound of a significant supply node between $60,000 and the all-time high (ATH), where 2.63 million BTC (13.4% of the circulating supply) is located. This concentration indicates that many investors may be sensitive to price drops below $60,000.

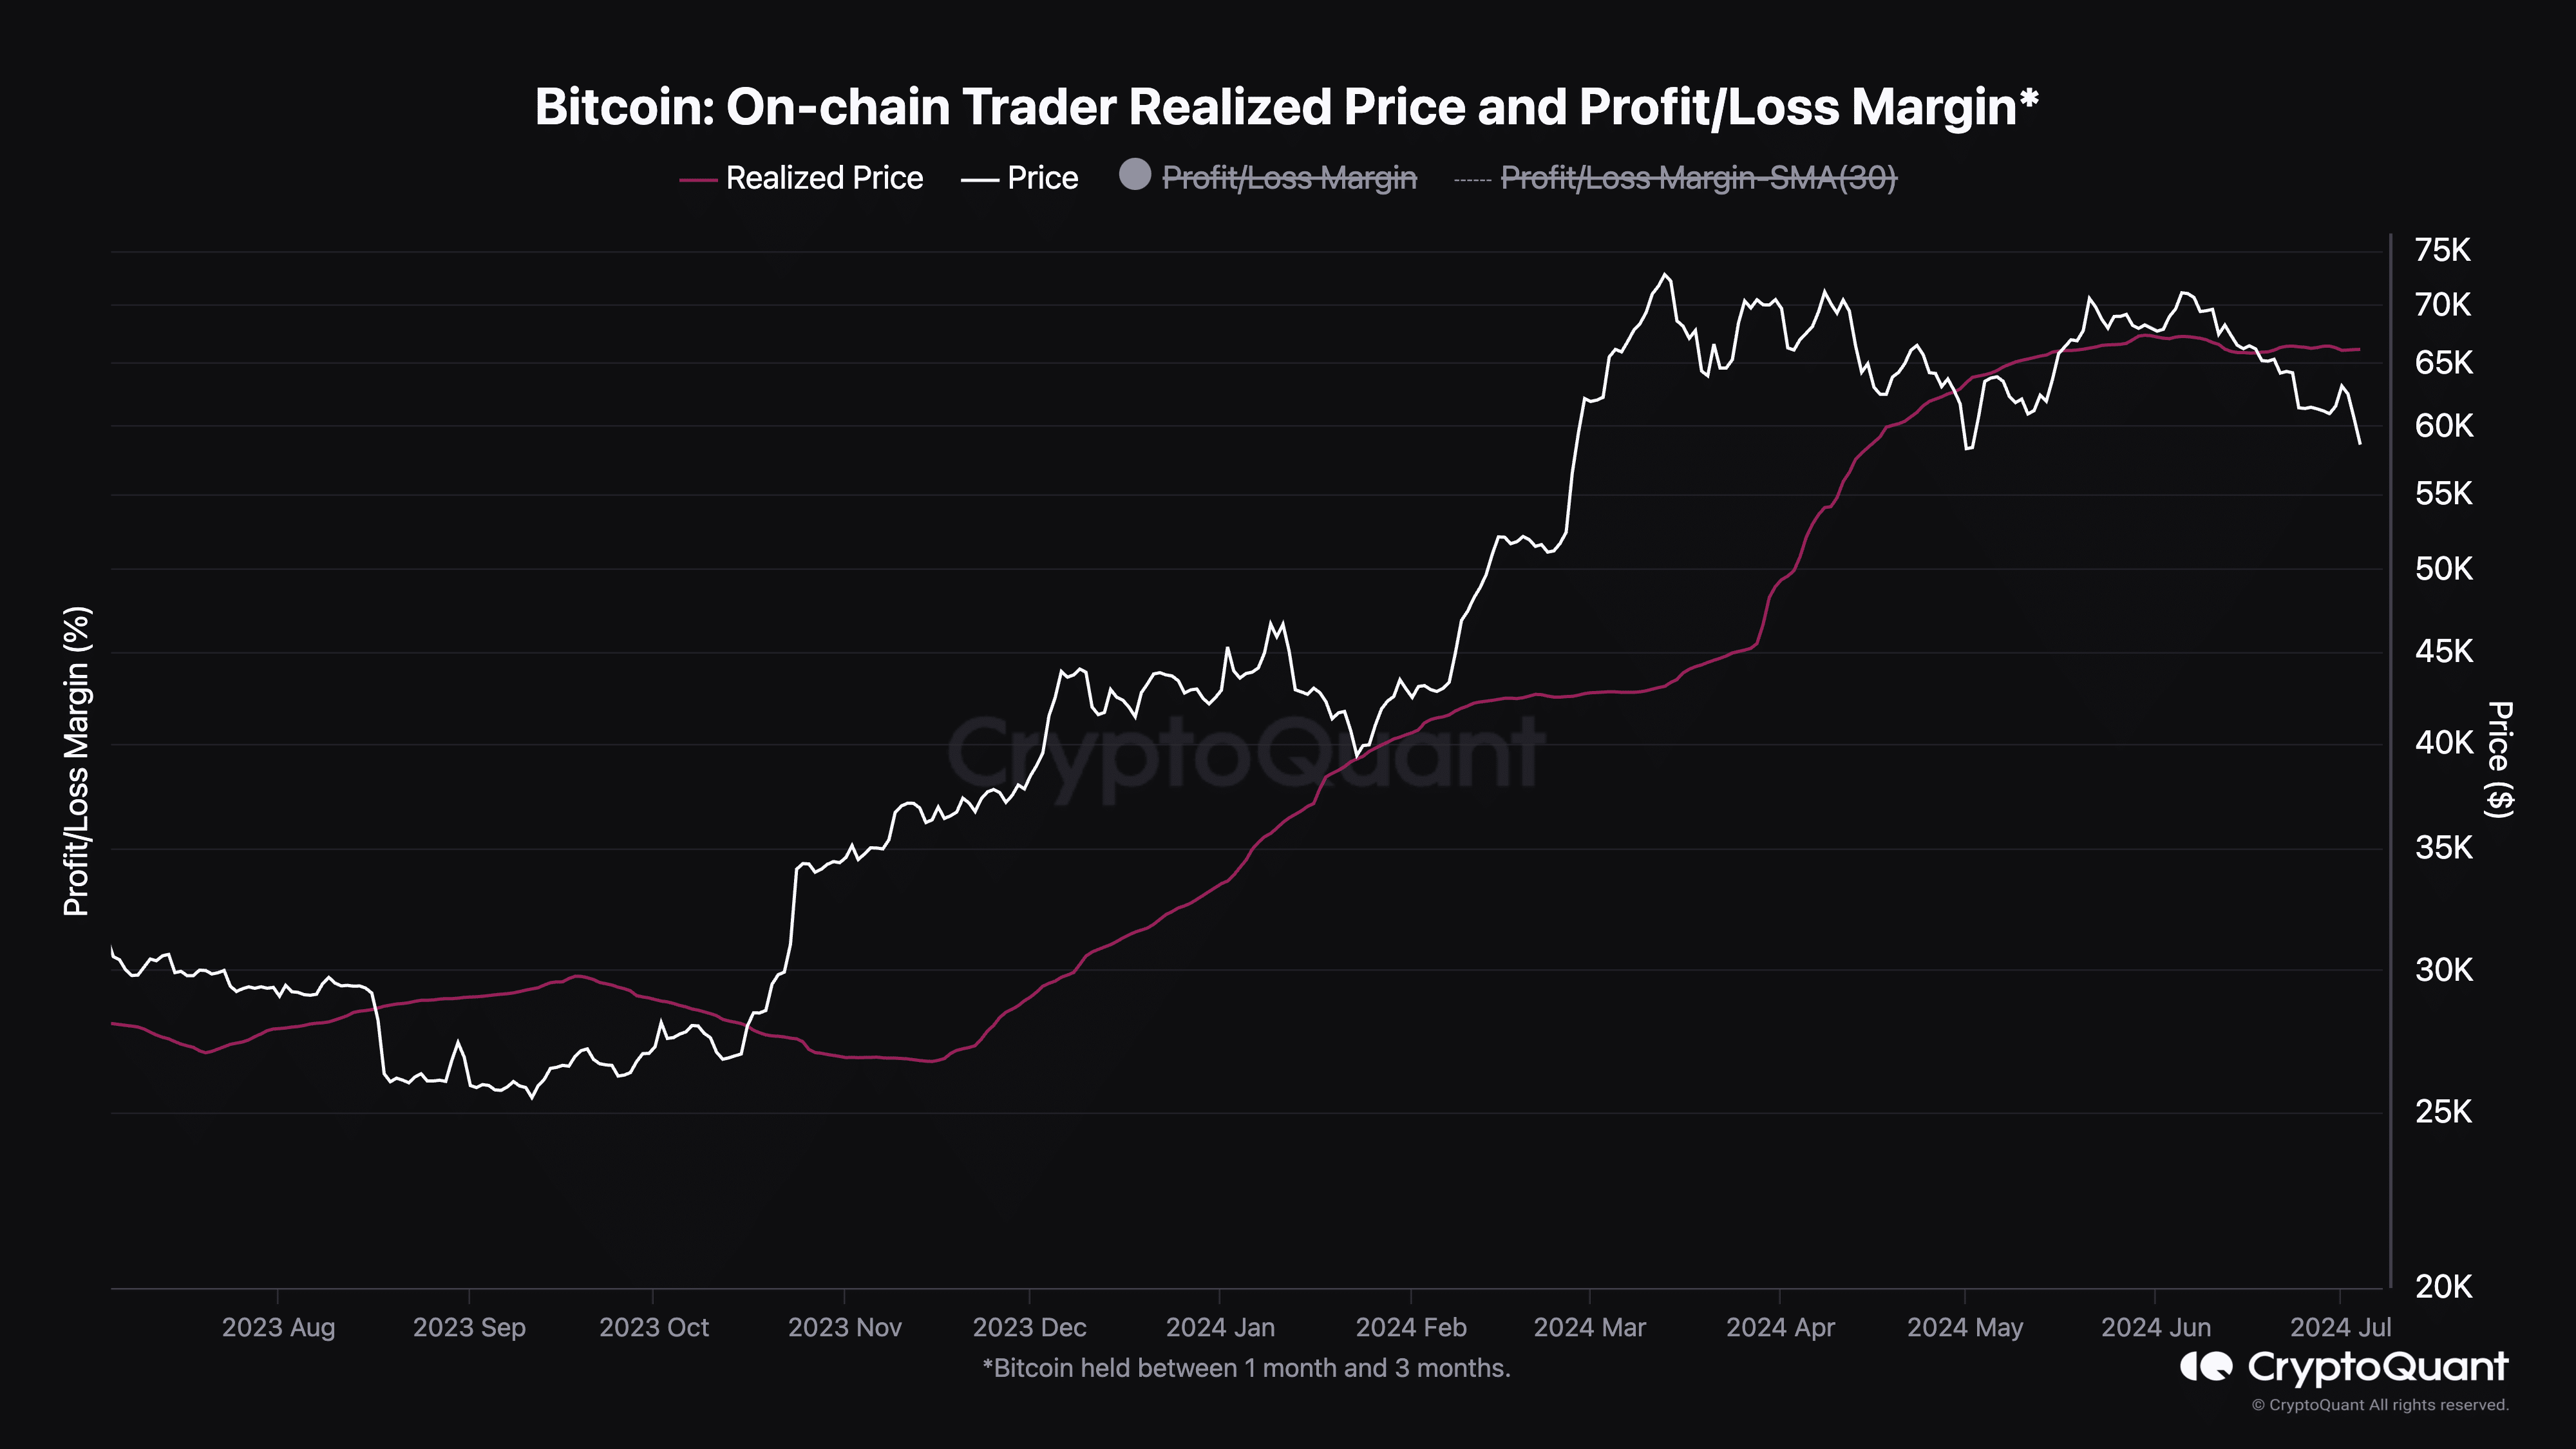
Additionally, Bitcoin has fallen below the On-Chain Trader Realized Price, reinforcing the bearish outlook.

You might also like: Bitcoin plummets 10% in 10 days: Learn how to spot the next crash
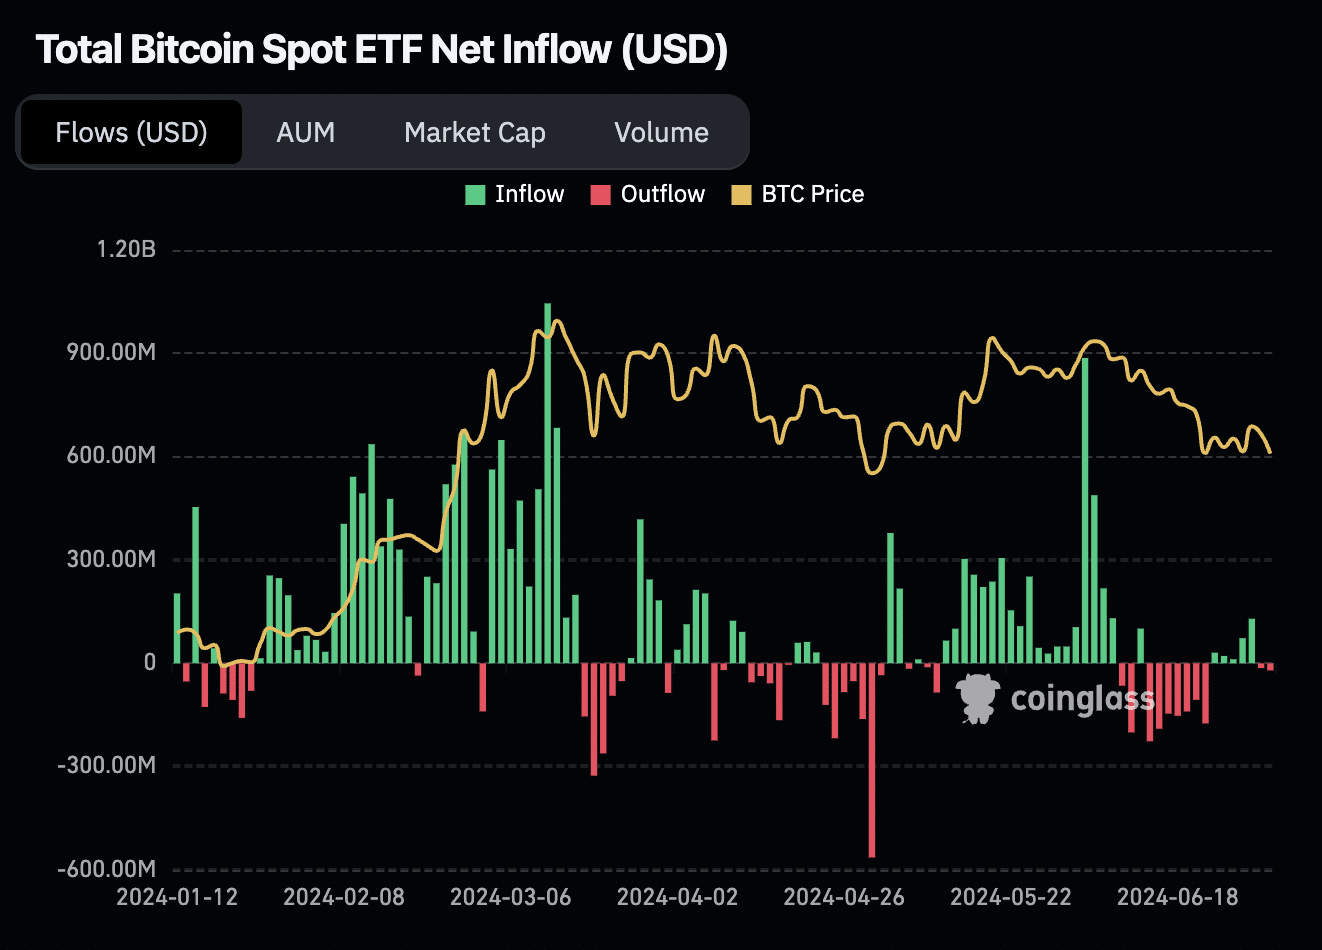
Despite significant interest in Bitcoin from big players in the financial industry, including Michael Saylor, and strong demand to invest in Bitcoin at these prices, recent data from CoinGlass shows that Bitcoin ETF inflows have been declining, and outflows have started. This shift indicates that despite the demand, there is an increasing bearish sentiment in the market, even from institutional investors.

Considering all the factors, it is possible that Bitcoin will remain at lower levels for some time, potentially until September or October.
Given this outlook, the strategy involves two scenarios. If one finds these prices appealing, the first approach is to dollar-cost average into Bitcoin now and continue to do so if it drops further. Alternatively, one could wait for a potential drop to the $50,000 – $52,000 range to enter a long position. Historically, investing in Bitcoin while it is below the 200-day MA has proven to be a strong long-term decision.
Disclosure: This article does not represent investment advice. The content and materials featured on this page are for educational purposes only.


