


Less than 24 hours after the 4th Bitcoin (BTC) halving took place, the price climbed above $65,000. The event took place on April 20 as miners’ rewards were cut from 6.25 BTC to 3.125 BTC.
It is important to note that this happened as Bitcoin produced block number 840,000. Before the event, market participants expected the halving to cause high volatility with prices swinging very high or very low.
However, that was not the case as BTC moved sideways between $63,000 and $64,000. But with the halving done and dusted, how will Bitcoin fare in the coming months? Here, Coin Edition analyzes the price to see if the cryptocurrency would hit the astronomical values many traders have set for it this cycle.
BTC/USD 4-Hour Analysis
Since facing rejection at $71,030, BTC has been moving between $60,000 and $68,000. However, there was solid support at $60,266 on the 4-hour chart, A breakdown between this price could send Bitcoin correcting to much lower levels like $56,000.
However, the Relative Strength Index (RSI) suggested otherwise as the reading increased. The rise in the RSI was a signal that momentum was bullish and this could foreshadow a higher price in the short term.
BTC/USD 4-Hour Chart (Source: TradingView)
However, the Money Flow Index (MFI) turned downward after an earlier surge, indicating that increasing capital in the market has decreased. Should this remain the case going forward, BTC might find it hard to cross the $73,000 region.
BTC Daily Chart Analysis
Looking at the daily chart, it was evident that Bitcoin’s price could decrease further before it goes on a rally. At press time, the Moving Average Convergence Divergence (MACD) was negative, suggesting a bearish momentum.
Furthermore, the 26 EMA (orange) was above the 12 EMA (blue), indicating that sellers were in place to outpace buying dominance. This trend, if validated, could capitulate the price of the coin.
Possible targets if this happens might be between $53,000 and $58,000. However, in the mid to long term, the price of Bitcoin is expected to surpass its all-time high. According to signals from the Fibonacci indicator, BTC might hit $73,246 after the correction is over.

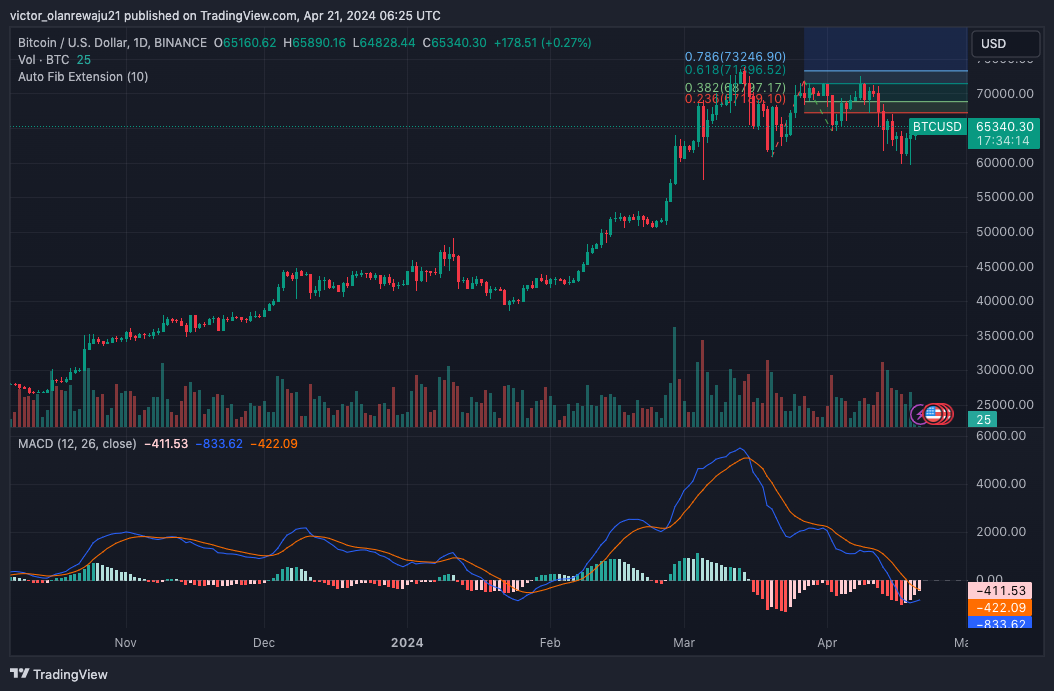
BTC/USD Daily Chart (Source: TradingView)
This was where the 0.786 Fib level was positioned. Afterward, a surge in the $85,000 direction could be next for the coin. However, it remains uncertain if BTC will hit six figures before the year ends.
Disclaimer: The information presented in this article is for informational and educational purposes only. The article does not constitute financial advice or advice of any kind. Coin Edition is not responsible for any losses incurred as a result of the utilization of content, products, or services mentioned. Readers are advised to exercise caution before taking any action related to the company.


