


 Elliott Wave forecasts amid tariff uncertainties")


- Shiba Inu’s on-chain metrics reveal robust adoption, as addresses with balances surge to 1.4 million.
- Shiba Inu’s returns stand at a solid 14.4% so far in April, poised to snap a three-month bearish trend from earlier this year.
- SHIB price is approaching $0.000015, buoyed by widespread bullish sentiment in the crypto market and a technical breakout.
Shiba Inu (SHIB) price climbs higher and trades at $0.00001413 at the time of writing on Friday amid a wider bullish outlook in the cryptocurrency market. The second-largest meme coin, with a market capitalization of approximately $8.3 billion, is up more than 2% daily, supported by growing adoption and a strong tailwind.
Shiba Inu’s returns soar in April
Shiba Inu’s on-chain data shows steady, consistent growth in addresses holding balances, with IntoTheBlock’s chart confirming a new all-time high of 1.4 million active addresses. This sustained uptrend underscores expanding network adoption and signals robust investor engagement.
Shiba Inu addresses stats | Source: IntoTheBlock
The bullish streak in the last couple of weeks has been welcomed by SHIB investors, whose portfolios had been heavily battered in the first quarter of the year. According to analytics data by CryptoRank, Shiba Inu posted negative monthly returns of 10.9% in January. This trend continued in February and March, with the returns sliding by 26.1% and 11.1%, respectively.
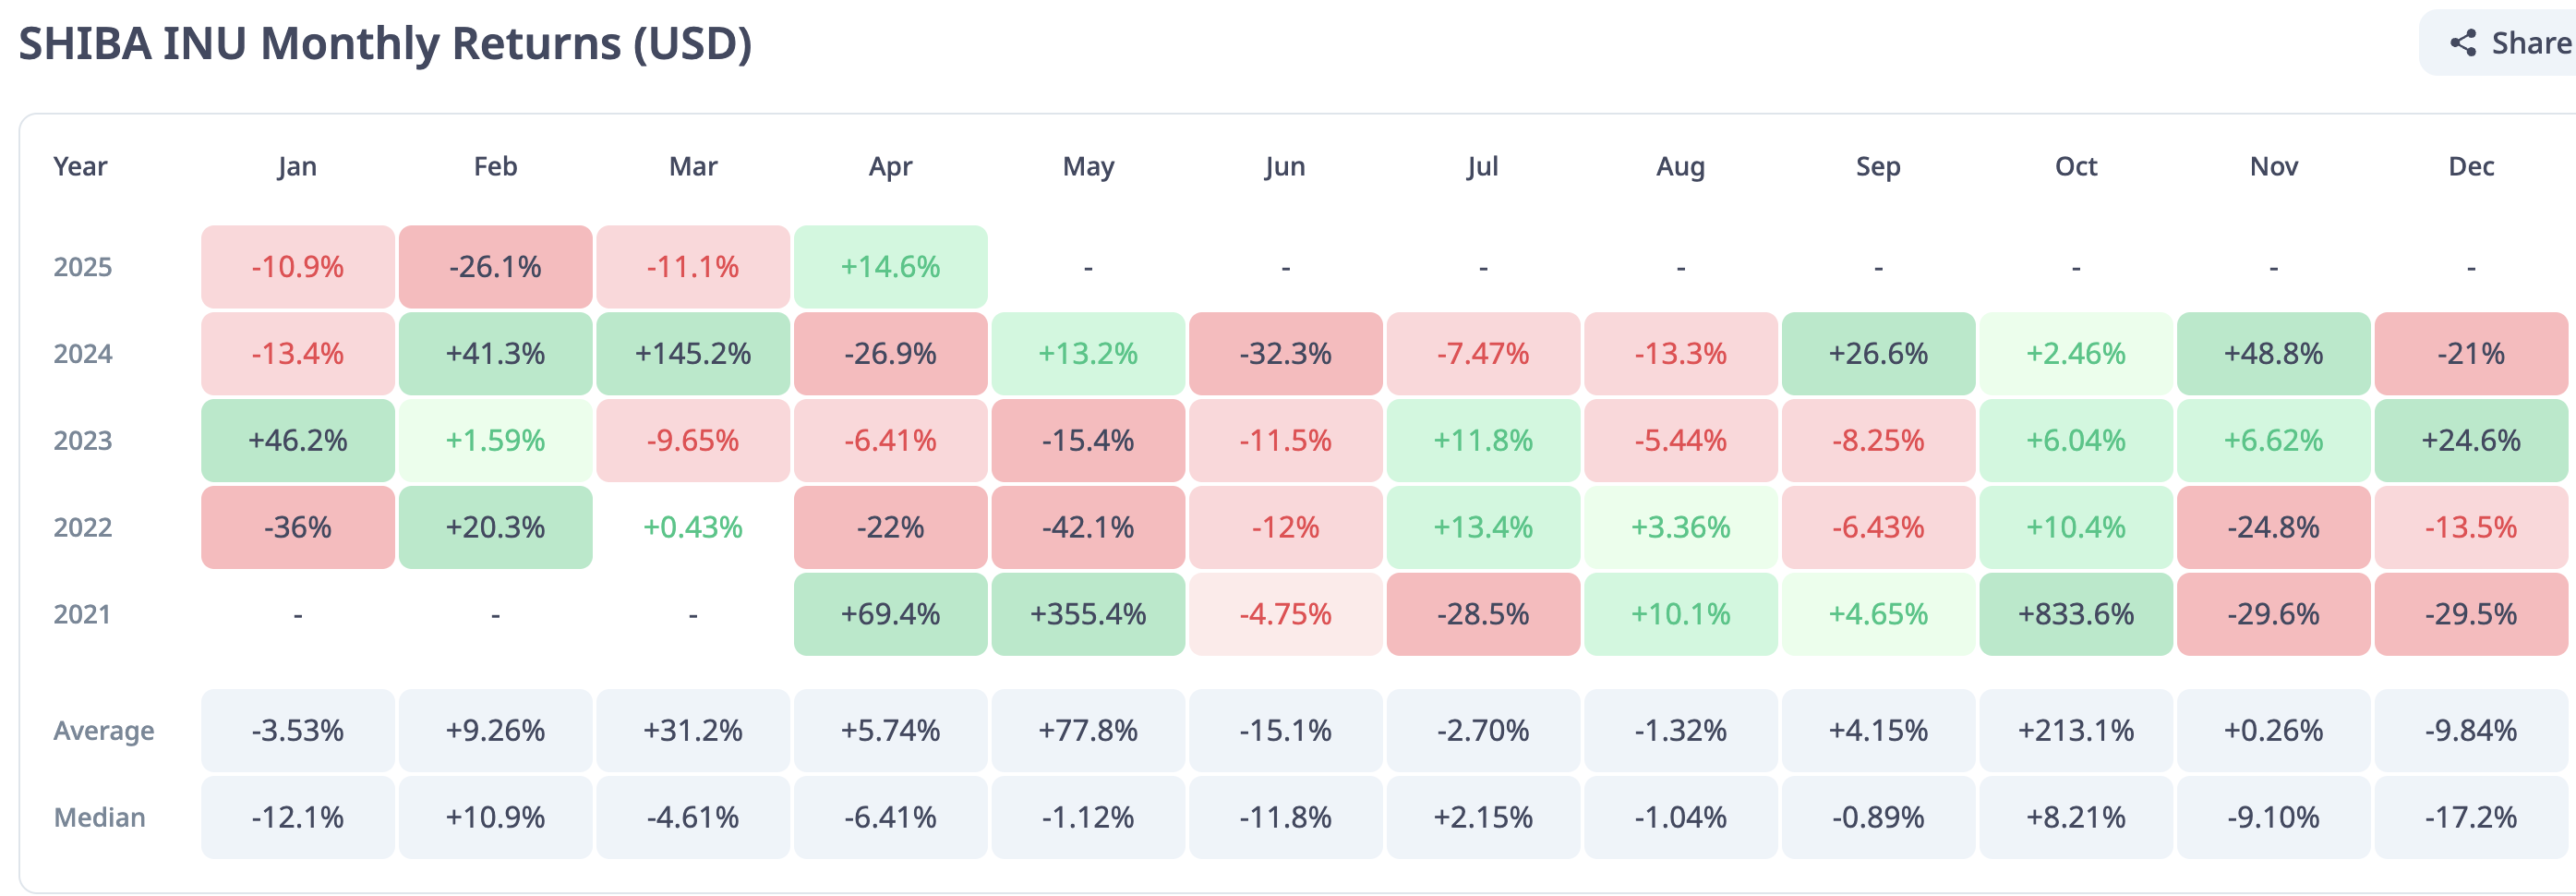

SHIB monthly returns | Source: CryptoRank
Shiba Inu is set to close the month with positive returns, marking SHIB’s first April gain in three years. This breakout from a prolonged bearish phase signals a potential shift in market dynamics.
How far could SHIB’s uptrend go?
Shiba Inu’s price continues to extend its gains, trading at $0.00001413 at the time of writing, signaling growing interest in digital assets and, importantly, meme coins. In addition to a general bullish wave across the wider cryptocurrency market this week, SHIB validated a breakout from an inverse head and shoulders pattern on the 4-hour chart on Sunday.
The breakout positioned Shiba Inu for a 20% move that could see it tag highs at $0.00001471. This target is determined by measuring the pattern’s height from the center of the neckline down to the head, as shown on the chart below, and extrapolating above the breakout point.
It is worth noting that the 4-hour 50 Exponential Moving Average (EMA) crossed above the 200 EMA on Wednesday, confirming high conviction among traders who bet on higher prices. Should the 100 EMA cross above the 200 EMA in upcoming sessions, Shiba Inu could accelerate the uptrend beyond the inverse head and shoulders pattern’s target of $0.00001471, and even surpass the key milestone at $0.000015.
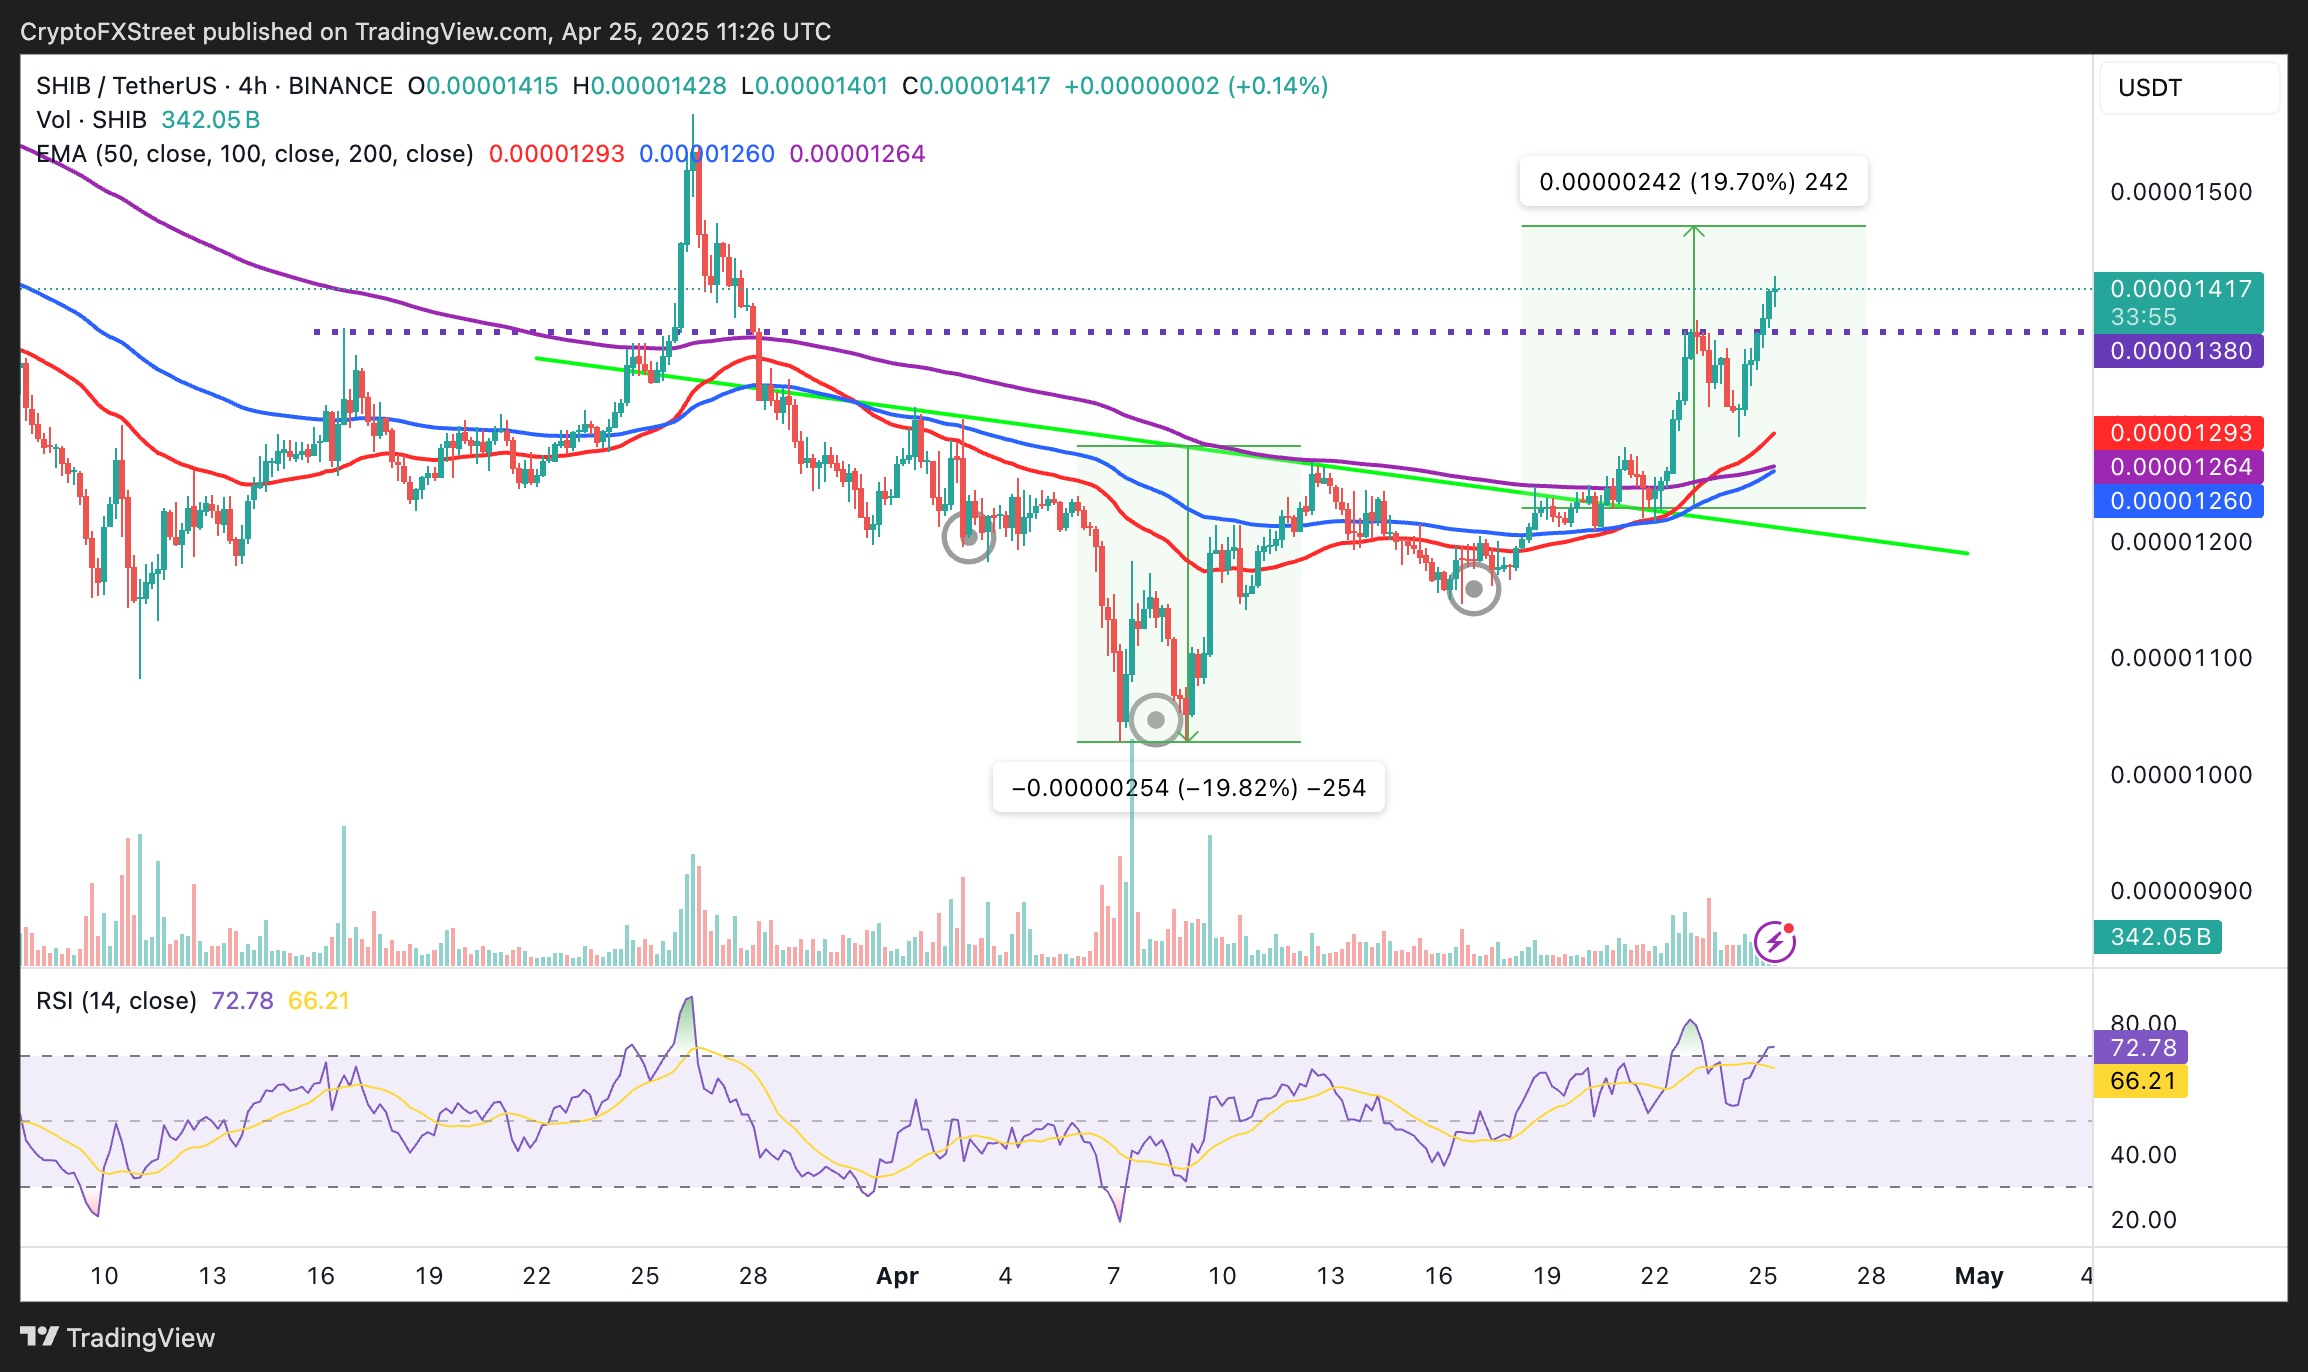

SHIB/USDT 4-hour chart
The Relative Strength Index (RSI) indicator’s overbought position at 72.65 highlights a potential risk to the uptrend. If the RSI indicator slides below 70.00, entering the neutral area, Shiba Inu could fold the uptrend, clawing back this week’s accrued gains. Looking down, traders may consider key levels like Wednesday’s resistance at $0.00001380, the 50 EMA at $0.00001293 and the 200 EMA at $0.00001265 as tentative support areas.


