Monero (XMR) has experienced a notable uptrend recently, trading at $175.01, marking a 1.47% gain over the past 24 hours. This positive shift in Monero’s price can be attributed to a series of bullish movements that have unfolded over the past few days.
The cryptocurrency has steadily climbed from a low of around $172.55 to its current level, displaying a consistent pattern of higher highs and higher lows. This price action suggests a strong bullish momentum in the short term.
In analyzing the key support and resistance levels for Monero, several insights emerge. The immediate support level is found around $172.50. This area has previously provided a base for the price before its recent upward surge.
Additionally, a deeper support level exists at $171, which has also demonstrated its ability to trigger a price rebound.
Source: Coinmarketcap
On the resistance front, Monero is currently testing the $175 mark. This resistance level is critical as it represents the upper boundary of the recent price movement. If Monero manages to surpass this resistance level convincingly, the next potential resistance could be observed in the $176-$177 range. This projection is based on the continuation of the current upward trend.
Volume data supports the ongoing bullish sentiment. There has been a 12.53% increase in trading volume over the last 24 hours, highlighting growing market interest. This increase in volume is a positive indicator that backs the current price movement.
Furthermore, derivative market data shows a significant uptick in activity. As per Coinglass data, the volume of Monero derivatives has risen by 35.21% to $33.77 million, while open interest has increased by 6.26% to $14.02 million. The 24-hour long/short ratio stands at 1.1137, reflecting a slightly bullish sentiment among traders.
On Binance, the XMR/USDT long/short ratio is 0.6581, indicating more short positions. The top trader long/short ratio is 0.6838, and positions are at 0.6861, signaling a cautious optimism.
Liquidation data also reveals interesting trends. Shorts are experiencing greater losses compared to longs. Over the past hour, liquidations totaled $1.96K, increasing to $71.12K over 24 hours. This indicates that shorts are facing heavier losses across various timeframes.

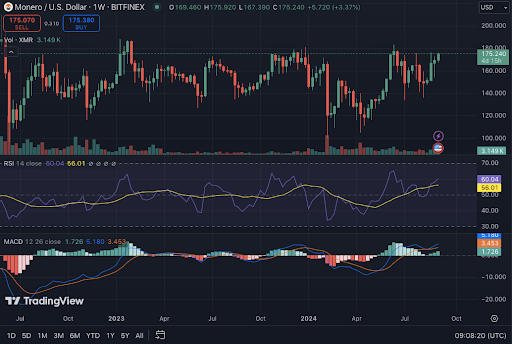
XMR/USD 1-week price chart, Source: Trading view
Technical indicators also paint a mixed picture. The 1-week Relative Strength Index (RSI) for Monero is at 60.21, suggesting that the cryptocurrency might be approaching overbought conditions but is not yet in a critical zone. Additionally, The 1-week Moving Average Convergence Divergence (MACD) is trading above the signal line, confirming positive momentum.
Disclaimer: The information presented in this article is for informational and educational purposes only. The article does not constitute financial advice or advice of any kind. Coin Edition is not responsible for any losses incurred as a result of the utilization of content, products, or services mentioned. Readers are advised to exercise caution before taking any action related to the company.


