


XRP has traded between $2.58 and $2.61 over the last hour and within a tight 24-hour range of $2.48 to $2.64. The digital asset boasts a market cap of $150 billion and a 24-hour trade volume of $4.44 billion, highlighting significant activity in a narrow corridor.
XRP
XRP’s 1-hour chart shows a rebound from the $2.47 low, with the price retesting the $2.60–$2.63 resistance zone. Increasing buy volume suggests potential upside, though failure to breach $2.65 could trigger a retracement to $2.50–$2.55 support. Scalpers may consider long positions above $2.60, targeting $2.70, while bears could capitalize on rejection at $2.65 for a short-term dip. Immediate momentum hinges on holding $2.60 as local support.
XRP/USDT via Binance 1H chart on Feb. 19, 2025.
The 4-hour timeframe highlights a rally from $2.3 to $2.83, followed by consolidation between $2.50 support and $2.65–$2.70 resistance. XRP’s high sell volume during the recent drop contrasts with recovery candles indicating buyer interest. Traders eye a breakout above $2.60 for a push toward $2.75–$2.80, while rejection at this zone may renew downside pressure toward $2.50. A close above $2.70 could signal renewed bullish momentum.


XRP/USDT via Binance 4H chart on Feb. 19, 2025.
XRP’s daily chart reveals volatile swings, peaking at $3.4 before plunging to $1.77 and stabilizing near $2.50–$2.60. The $2.4–$2.5 zone remains critical support, with resistance at $2.8, $3.0, and $3.4. A sustained hold above $2.50 with strong bullish candles may validate long entries targeting $2.80–$3.00, while rejection at $2.8–$3.0 could reignite bearish bets. Volume spikes suggest accumulation, but the macro direction remains contested.
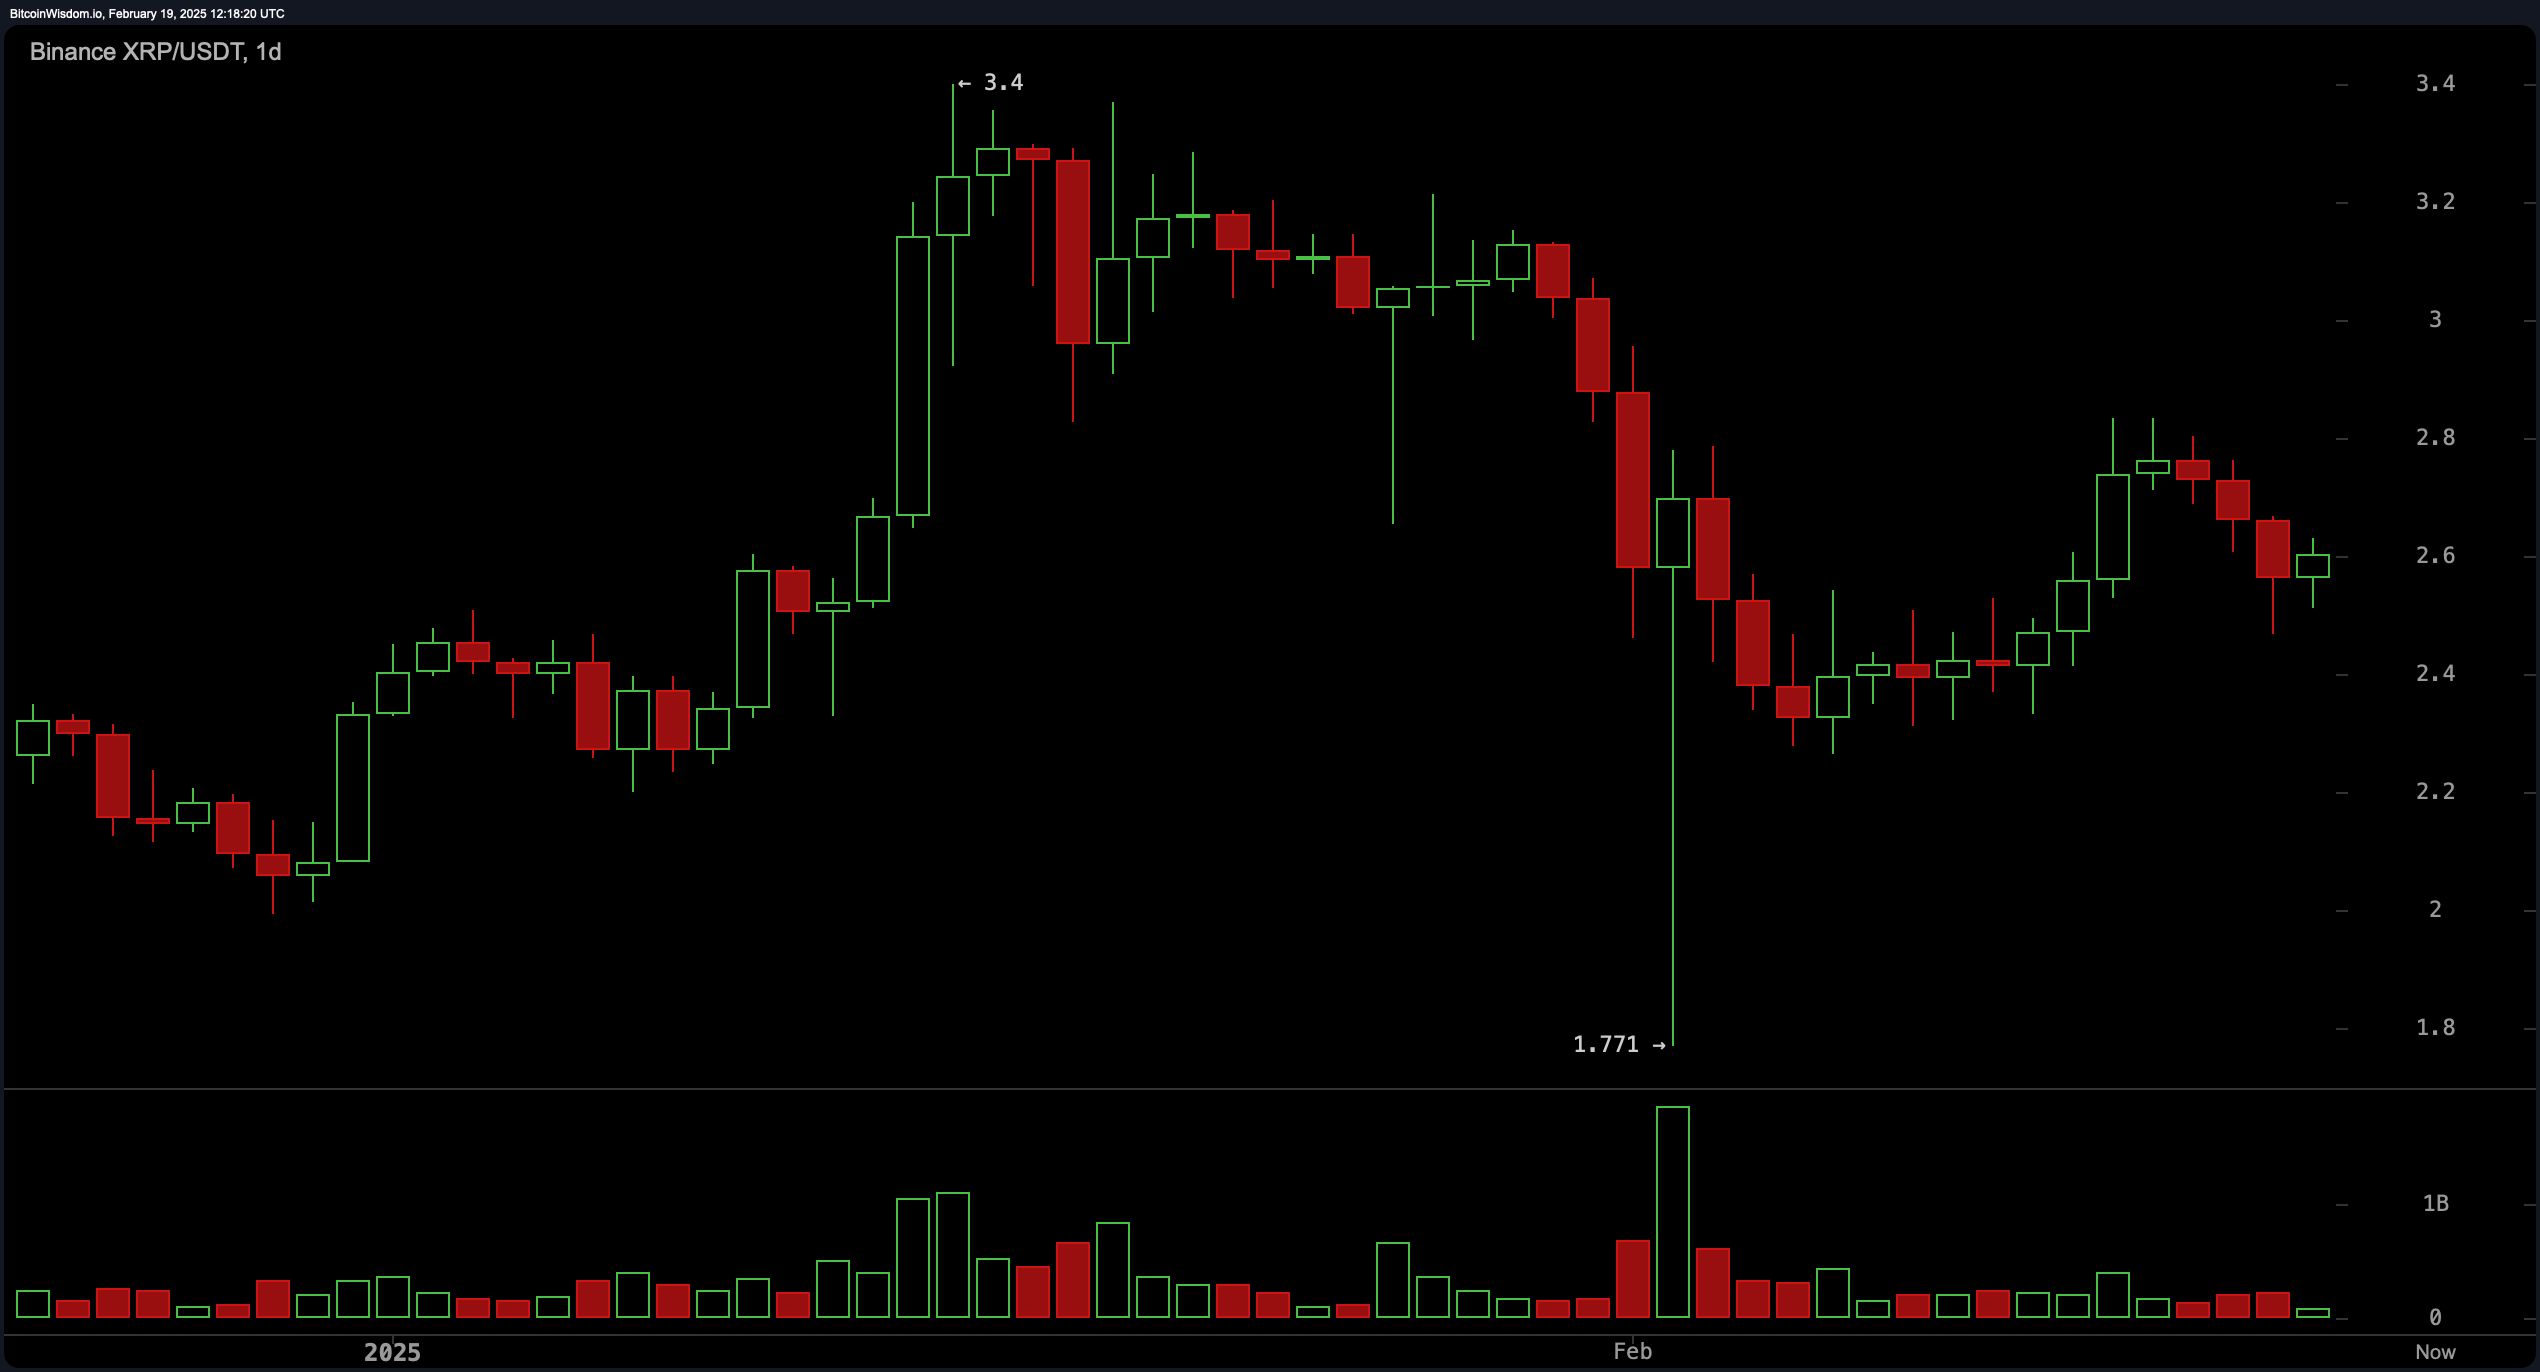
XRP/USDT via Binance 1D chart on Feb. 19, 2025.
XRP’s oscillators on the daily chart signal caution: the relative strength index (RSI) at 47.65 and Stochastic at 59.57 remain neutral. The commodity channel index (CCI) at 2.64 and the average directional index (ADX) at 30.68 also show indecision. However, the awesome oscillator (-0.12) suggests a sell signal, while momentum at 0.20 and moving average convergence divergence (MACD) at -0.03 lean bullish, creating conflicting short-term cues.
The daily chart’s moving averages (MAs) paint a split picture: exponential moving averages (EMA 10, 20, 30) at 2.61, 2.63, and 2.64 signal sells, while simple moving averages (SMA 10, 20, 50) at 2.59, 2.57, and 2.71 indicate buys. Longer-term EMAs (50, 100, 200) and SMAs (100, 200) between 1.43 and 2.71 broadly favor accumulation. Traders must reconcile conflicting signals, with shorter EMAs urging caution and SMAs supporting bullish reversals if key levels hold.
Bull Verdict:
Technical indicators suggest accumulation with longer-term averages favoring bullish momentum. If XRP holds above key support levels, traders could see a rally toward higher resistance zones.
Bear Verdict:
Conflicting signals from short-term indicators—including sell cues from exponential moving averages and the awesome oscillator—warn of potential downside risk if key resistance levels remain unbroken.


