


Bitcoin may have recently hit a local bottom, according to the Hash Ribbons indicator.
Amid recent macroeconomic uncertainty, speculation has continued to mount over whether Bitcoin has topped out. According to one key metric, however, it might be quite the opposite.
End of Miner Capitulation
Bitcoin may have recently hit a local bottom, according to the Hash Ribbons indicator.
The Hash Ribbons indicator assumes that Bitcoin tends to hit a local bottom when miners capitulate—sell their Bitcoin holdings to stay afloat or shut down as mining costs rise above profitability. This usually occurs when the asset price falls or running costs rise.
The indicator offers Bitcoin buy signals by trying to pinpoint phases in this capitulation using the 30-day and 60-day hash rate moving averages.
The hash rate refers to the computing power used by Bitcoin miners. This metric often rises when more miners join the network or expand operations, typically driven by a rise in the asset’s price. On the other hand, the hash rate falls when miners shut down as profitability drops.
When the 30-day hash rate moving average cuts below the 60-day moving average, i.e., the average hash rate trends lower in the short term due to miners logging off, miner capitulation is believed to have started, inducing selling pressure.
On the other hand, when the 30-day MA cuts above the 60-day MA, it often signals the end of the worst of the miner capitulation, marking reduced selling pressure and the chance for a rebound.
Per the chart, this capitulation kicked off in early February 2025 and was likely exhausted over the weekend. The last time it did in October 2024, Bitcoin kicked off an over 50% rally from below the $70,000 mark to $106,000 days later.
Bitcoin Hash Ribbon indicator Source Glassnode
Interestingly, the recent miner capitulation signal aligns with a new mining difficulty record. For context, the mining difficulty measures how hard it is to mine a new block on the blockchain compared to the baseline in 2009.
Network participants typically see a rise in the metric as positive for the asset and indicative of better network security and health.
On Sunday, February 9, the metric surged 5.6% from 108.11 trillion to hit a new all-time high of 114.17 trillion at block 883,008, suggesting that it is now 114 trillion times harder to mine a block on the network compared to when it first launched, per CoinWarz data.

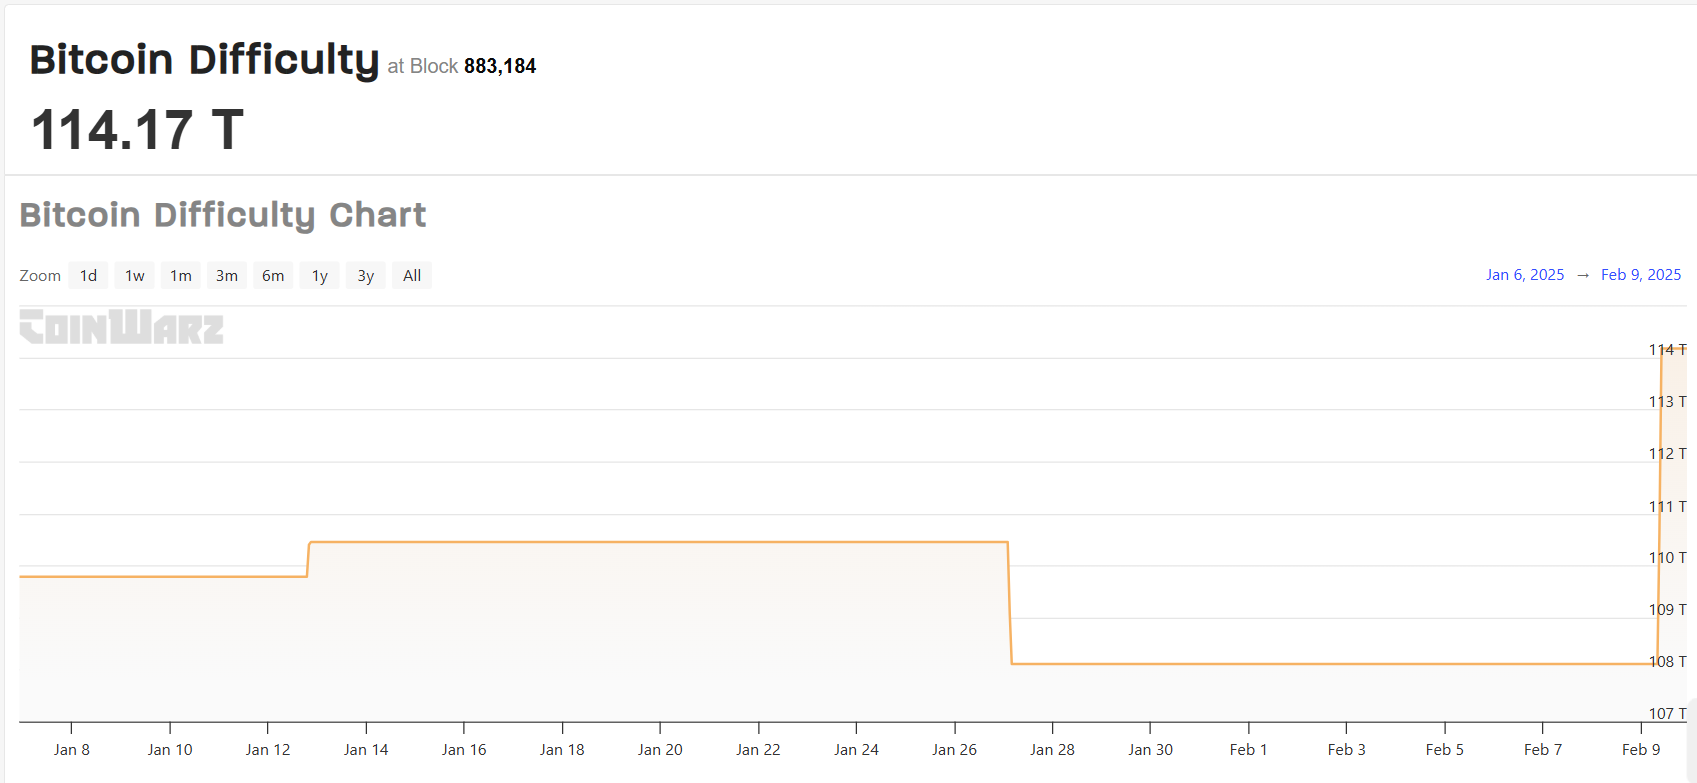
Bitcoin mining difficulty chart Source CoinWarz
The mining difficulty adjusts every 2,016 blocks, with the next adjustment expected to come in 0.33% higher at 114.55 trillion at block 885,024 on Sunday, February 23.
Amid these shifts in on-chain metrics, Bitcoin trades near $97,500 at the time of writing. If these positive metrics trigger a favorable price response, Bitcoin could again aim for the $100,000 psychological mark.

 Trades Sideways With Weak Trend but Signs of Bullish Shift Emerge")


