


A cryptocurrency trader has raised alarm regarding Bitcoin’s (BTC) recent price fluctuations, suggesting that these sharp movements may be driven by market manipulation rather than genuine market fundamentals.
Over the past two weeks, Bitcoin has experienced significant volatility, moving within the $65,000 to $52,000 range. These sharp fluctuations, both upward and downward, have raised questions about the underlying forces driving the market.
RLinda, a well-known trader and analyst, highlighted Bitcoin’s struggle to break past key resistance levels, signaling a potential correction toward the $52,000 mark as downward pressure builds.
Bitcoin’s bearish market structure
According to the analysis, Bitcoin is currently trading within a sideways range. Despite a brief rally of 7% following a retest of the $59,000 level, this upward movement lacked strong technical or fundamental support.
RLinda observed that the price failed to break through the critical resistance zone near $65,000, leading to an 11% drop back to $59,000.
Currently, Bitcoin is striving to maintain its position above the $62,000 mark, with many market participants believing that long-term bullish momentum persists for the asset.
For Instance,a recent analysis by Titan of Crypto suggested that Bitcoin could potentially surge to $105,000 in this ongoing market cycle.
However, the false breakout above $65,000 confirmed a bearish market structure, with Bitcoin continuing to form a local downtrend. The formation of this downtrend within the broader sideways range between $65,000 and $52,000 is a key signal for traders.
The shift in market sentiment to bearish and the development of a downtrend channel observed on both daily and weekly timeframes are also significant indicators.
Bitcoin key price levels to watch
Bitcoin is currently testing resistance near $63,400 as part of its recent rally. However, RLinda cautions that there is insufficient accumulation or technical strength to surpass this area, making further growth unlikely.
The lack of dominant buying pressure suggests that any upward movement will likely be capped by the resistance zones, with a high probability of a reversal and a decline toward the lower support levels.
Key resistance levels identified by RLinda include $63,400, which is the current resistance zone being tested. The next critical level is $64,130, which could trigger a sell-off if Bitcoin struggles to break through.
Finally, $65,000 represents the upper boundary of the sideways range and is a crucial level that Bitcoin needs to surpass for a more sustained upward movement.
On the downside, support levels to watch include $61,320, a significant level that, if broken, could accelerate the bearish move, and $59,000, the lower end of the current range. A break below $59,000 could lead to a deeper correction, increasing the likelihood of further declines.
Bitcoin’s bearish outlook
Adding to the bearish outlook are concerns over rising U.S. inflation, driven by hotter-than-expected CPI and PPI data, which have shaken global markets.
These inflationary pressures, combined with expectations of further interest rate hikes, present additional challenges for Bitcoin, as investors shift away from riskier assets like cryptocurrencies.
From a technical perspective, analyst Ali Martinez predicts a potential drop to $52,000, highlighting Bitcoin’s movement within a descending parallel channel, a pattern often associated with further declines. Alan Santana shares a similar sentiment, warning of a possible crash to $49,000.
Bitcoin price analysis
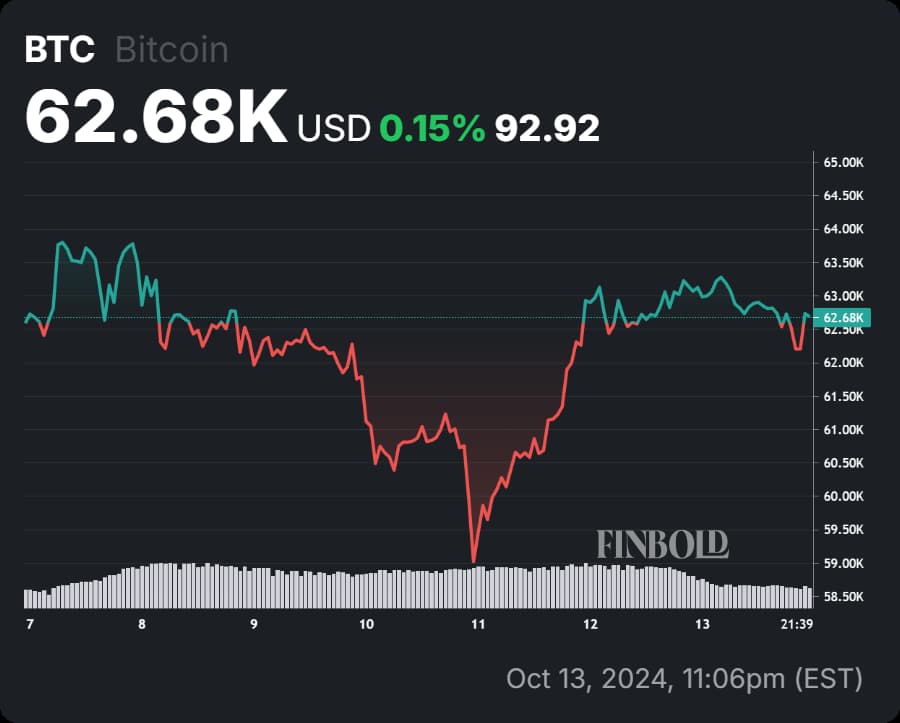
At the time of writing, Bitcoin is trading at $62,689, reflecting a 1.5% drop in the past 24 hours. On a weekly basis, the asset is down less than 1%, highlighting ongoing market uncertainty.

Despite testing resistance near $63,400, the market lacks the technical strength to break through this zone, increasing the likelihood of a reversal toward lower support levels.
Given the current lack of upward momentum and the bearish signals from technical indicators, investors should closely monitor key support levels, particularly at $59,000 and $52,000.
Further downside movement remains a strong possibility, especially as macroeconomic factors, such as inflation concerns, continue to weigh on riskier assets like Bitcoin.


