


On Wednesday, via the 1-hour chart, bitcoin is forming a potential inverse head and shoulders pattern around the $61,500 level. If confirmed by a breakout above $62,000, this could signal a bullish reversal. Additionally, the 4-hour chart reveals a descending channel from $65,144 to $58,456, where a breakout above the channel’s upper boundary near $62,000 may also suggest a trend reversal is on the horizon.
Bitcoin
Currently, bitcoin’s price is $61,470, reflecting significant volatility in recent trading sessions. The daily chart shows price action around the recent low of $58,456 resembling a bullish hammer candlestick, which often indicates a potential reversal after a downtrend. The volume spike on the day of this drop suggests a selling climax, indicating the worst of the selling pressure might be over, potentially paving the way for an uptrend.
BTC/USD 1-hour chart.
On the 1-hour chart, bitcoin’s recent decline from $62,458 to around $61,500, coupled with increased volume during the decline, highlights strong selling pressure. If the price stabilizes at $61,500 and a bullish reversal pattern forms, a break above $62,000 would add confidence for traders. A potential exit strategy could target resistance levels between $62,500 and $63,000.

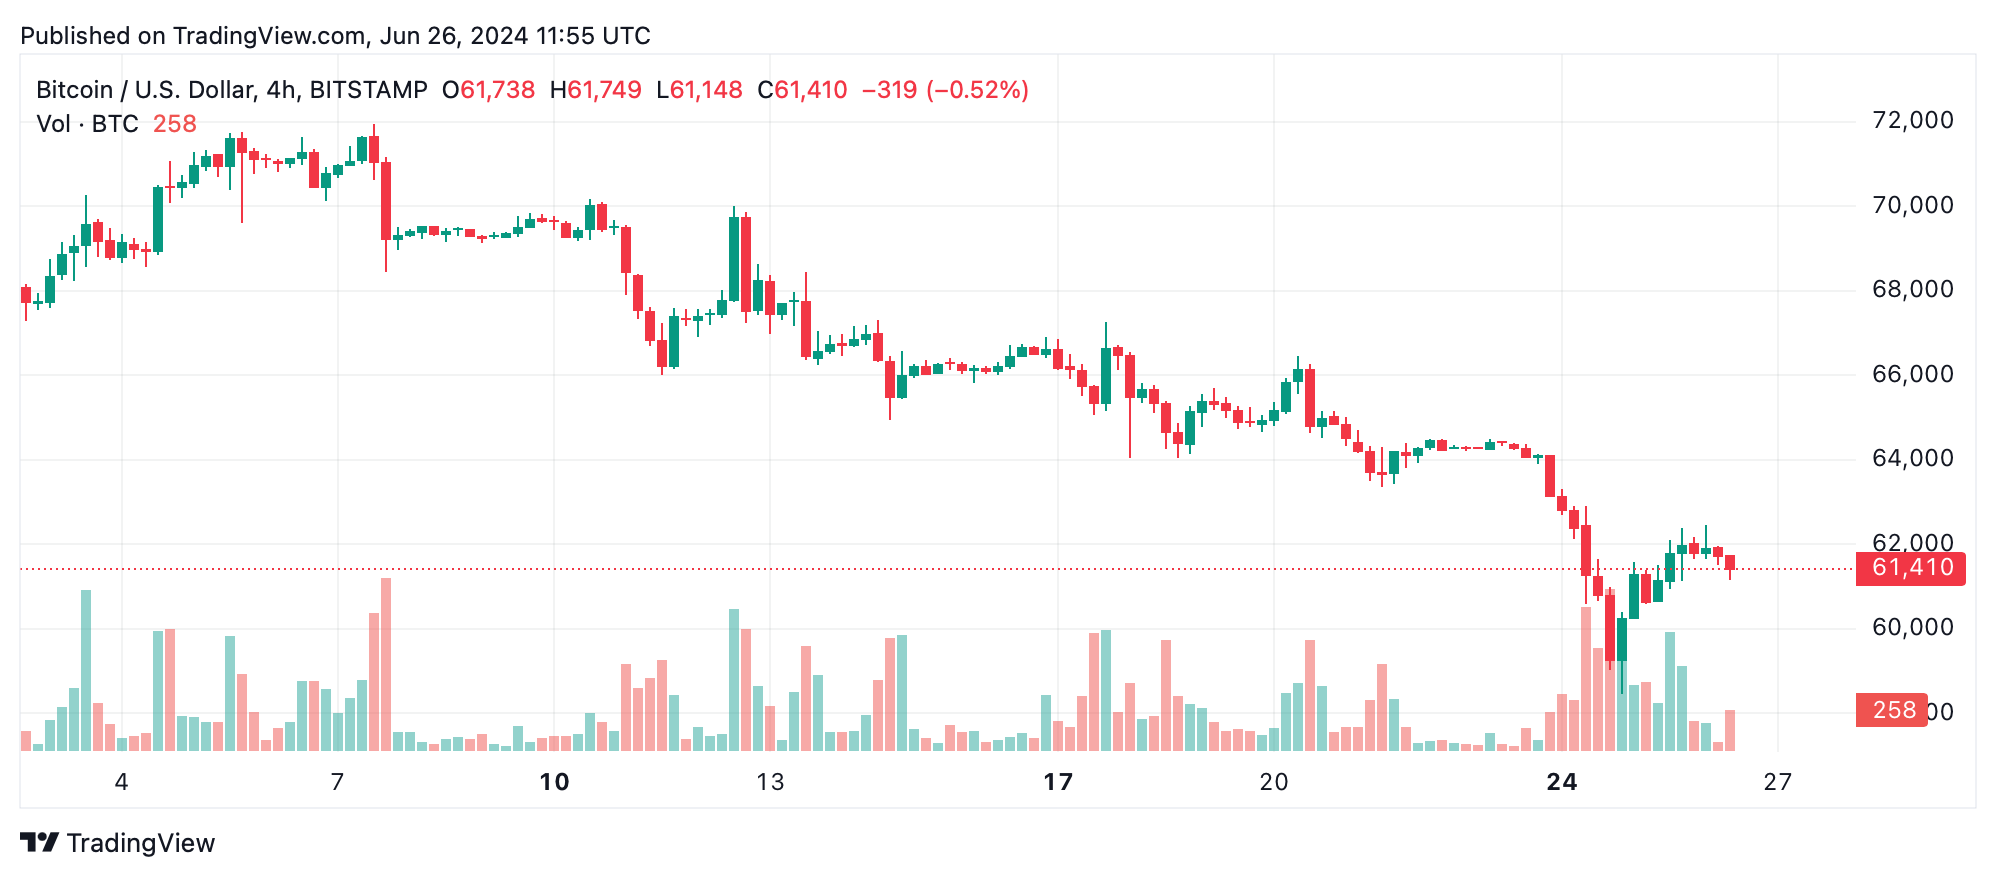
BTC/USD 4-hour chart.
The 4-hour chart provides a broader perspective of bitcoin’s downtrend from the $65,144 to the $58,456 zone, with a slight recovery to the $61,000 – $62,000 range. The significant volume during the drop to $58,456 suggests a capitulation point. An entry around $61,000 appears viable if consolidation occurs, signaling support.
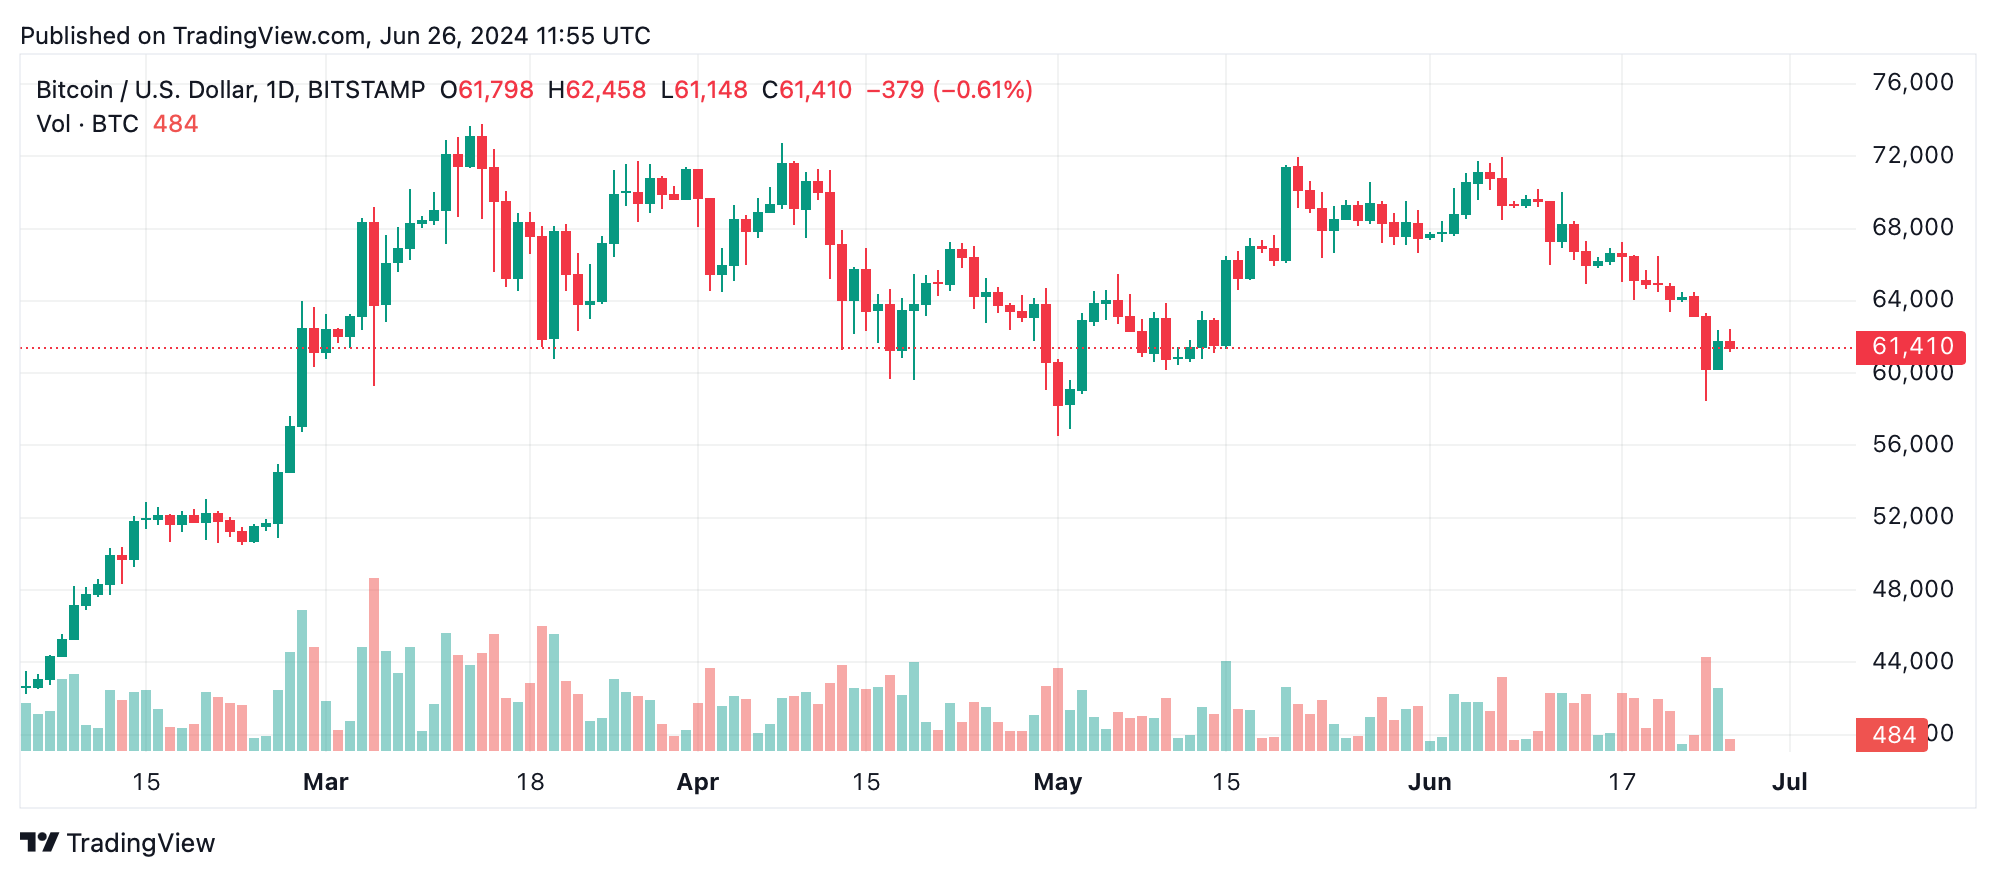
BTC/USD daily chart.
The daily chart underscores a clear downtrend from $71,949, with a bottom at $58,456 and subsequent recovery. The high volume during this drop and recovery suggests significant buying interest at lower levels. Entering around $61,000 – $62,000 for long-term positions could be strategic if bitcoin’s price stabilization continues.
Oscillator readings show mixed signals: the relative strength index (RSI) at 33 (neutral), Stochastic at 25 (neutral), and commodity channel index (CCI) at -130 (bullish), while the average directional index (ADX) at 28, awesome oscillator, momentum, and moving average convergence divergence (MACD) level suggest bearish trends. These indicators warrant caution.
Moving averages (MAs) reflect a predominantly bearish outlook. Exponential moving averages (EMAs) and simple moving averages (SMAs) for 10, 20, 30, 50, and 100 periods signal bearishness except for the 200-period EMA and SMA indicating bullish optimism. This divergence suggests potential long-term buying opportunities amidst short-term bearish trends.
Bull Verdict:
Based on the potential inverse head and shoulders pattern on the 1-hour chart, the descending channel breakout potential on the 4-hour chart, and the bullish hammer candlestick pattern on the daily chart, along with the possible golden cross on the 1-hour chart, the technical indicators suggest a bullish reversal for bitcoin. Traders should watch for a breakout above $62,000 to confirm this upward momentum.
Bear Verdict:
Despite the potential bullish reversal patterns, the overall bearish signals from the oscillators and moving averages indicate that bitcoin might continue to face downward pressure. Until a clear breakout above $62,000 is achieved, traders should remain cautious of further declines, as the current technical indicators predominantly point to a bearish trend.


 Trades Sideways With Weak Trend but Signs of Bullish Shift Emerge")


