


Bitcoin (BTC) remains a focal point of interest as it experiences significant consolidation, slightly above the $60,000 mark.
As the market anticipates Bitcoin’s next move, crypto trading expert Alan Santana shared his insights on the latest price movements in a TradingView post on June 30, providing potential correction targets.
Santana’s analysis revealed that the support range for Bitcoin’s upcoming drop termed the “maximum pain point,” lies between the Fibonacci retracement levels of 0.618 and 0.786. This range is calculated based on the latest bullish wave, indicating a broader view of the market movements.
Bitcoin’s next low
The key levels to watch are the 0.618 Fibonacci retracement level at $42,855 and the 0.786 Fibonacci retracement level at $34,900. Santana emphasized that Bitcoin’s price is unlikely to drop below $30,000, asserting that such a scenario would be unprecedented.
“Bitcoin shall never, ever, in the history of humanity’s kind trade below $30k. Think of the bottom of the correction, maximum pain point in-between this price range. Can be the low of the range just as it can be the high or the middle,” the expert said.
The analyst suggested that the bottom of the correction could fall anywhere within the specified range, whether at the lower end, the upper back, or somewhere in the middle.
It’s worth noting that Bitcoin continues to consolidate but increasingly faces the threat of dropping below the $60,000 support zone. Amid this consolidation, Bitcoin’s network is witnessing a significant resurgence of retail investors, as indicated by the surge in new BTC addresses.
According to data shared by crypto analyst Ali Martinez on June 29, the number of new Bitcoin addresses has surged to 352,124, marking the highest level since April.
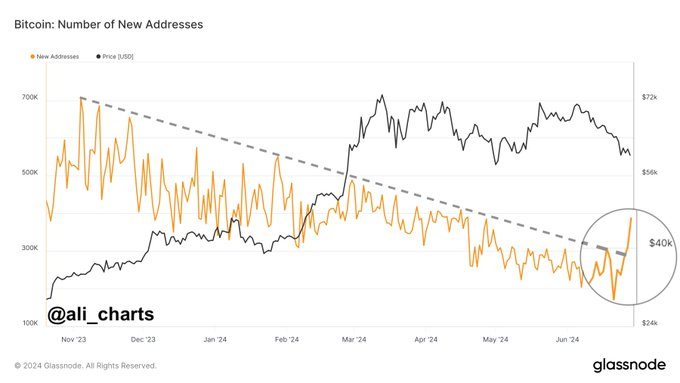

The resurgence of retail investors could signal renewed confidence in Bitcoin’s potential, even amidst its recent price corrections.
Bitcoin price analysis
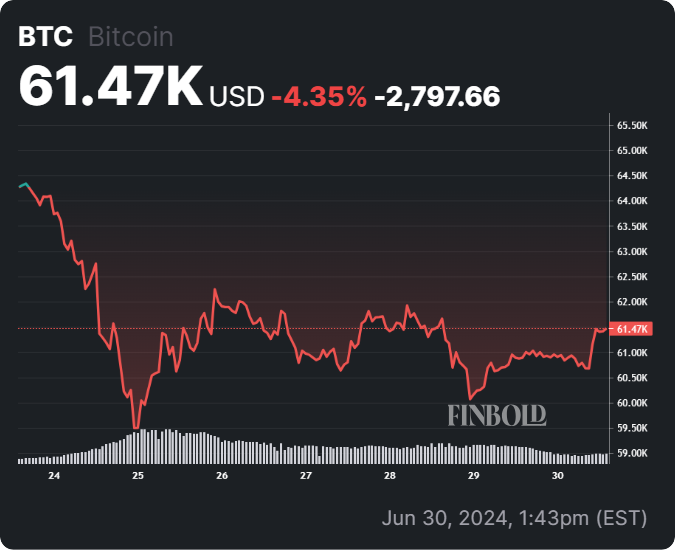
By press time, Bitcoin was trading at $61,470, with daily gains of almost 1%. On the weekly chart, Bitcoin is down over 4%.

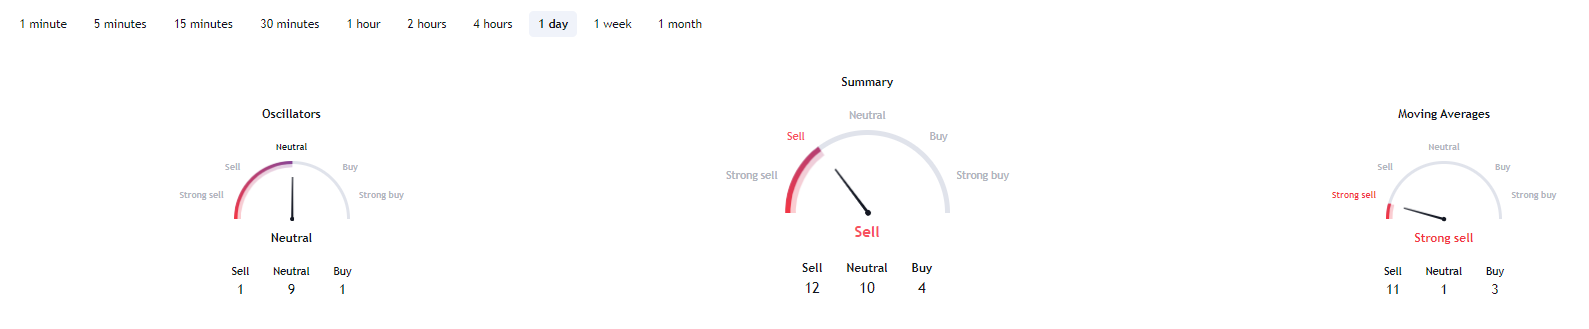
On the other hand, the one-day technical analysis for Bitcoin indicates mixed signals. Oscillators are primarily neutral, with nine neutral, one sell, and one buy indicator. Moving averages suggest a strong sell, with 11 sell, one neutral, and three buy indicators. Overall, the summary recommends selling Bitcoin, with 12 sell, 10 neutral, and four buy indicators.

In the meantime, with Bitcoin having reclaimed the $61,000 level, the asset must sustain gains above this mark to avoid further correction.
Disclaimer: The content on this site should not be considered investment advice. Investing is speculative. When investing, your capital is at risk


