


Ethereum (ETH) price may be entering the early stages of a new bullish phase. Both market analysts and on-chain data indicators reveal technical behavioral trends that support a renewed phase of strength for ETH price.
The monthly RSI created a new support level by touching a historical zone. Long-term holders also performed substantial withdrawals of ETH from centralized exchanges.
The RSI Retest Signals Historical Rally Setup for Ethereum (ETH) Price
When writing, the Relative Strength Index (RSI) was currently positioned in a zone that previously preceded major Ethereum rallies. According to market analyst cas_abbe, ETH’s monthly RSI has returned to the 40–42 range.
This level has been tested only three times before. Each time, it was followed by gains of more than 340%.
Source: X
In 2019, Ethereum (ETH) gained approximately 349% after reaching this zone. A 2020 retest preceded a rally of over 5,400%, and in 2022, ETH rose by more than 359% after a similar setup.
The analyst notes that ETH price is now consolidating in a technical “bottom area”, just as it did during the past three cycles. If the pattern repeats, ETH could reach $8,000 by the fourth quarter of 2025.
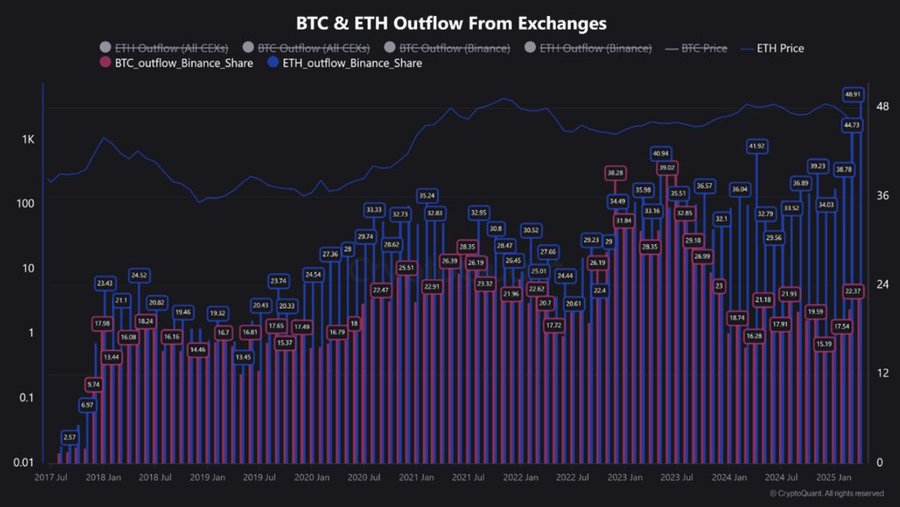
Exchange Outflows Reflect Long-Term Accumulation
ETH outflows from centralized exchanges represent an additional important indicator of positive market conditions.
Early 2025 witnessed the largest recorded Ethereum (ETH) withdrawals, which amounted to 49.91 million units according to CryptoQuant statistics.

Source| X
Institutional investors, alongside long-term holders, continue to extract ETH coins from centralized exchanges starting from mid-2023.
The 44.73 million ETH withdrawal from Binance confirmed that investors transfer their assets to personal control or protect them through long-term storage.
Historically, large outflows are viewed as bullish because they reduce the immediate supply available for sell-off.
Exchange balance declines often indicate an upcoming price recovery. It occurs when significant investor interest emerges during stable market periods.
Ethereum’s price stability during this market movement shows that selling pressure might be subsiding.
Exchange markets hold less supply, which presents an increasing risk of a supply decrease should demand increase.
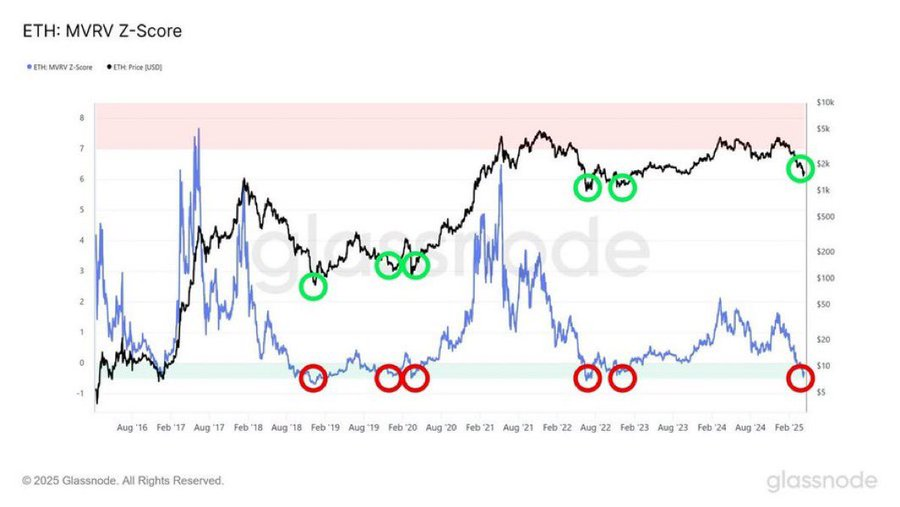
MVRV Z-Score Shows Ethereum May Be Undervalued
The MVRV Z-Score chart indicated bullish behavior for Ethereum (ETH) at press time. It tracks the market value against the realized value ratio.
The MVRV Z-Score indicated undervaluing conditions while going into the green zone according to long-term market performance data.
Source| X
Early in 2025, the MVRV Z-Score moved close to the green area. Previous entries into this range in late 2018, mid-2020, and early 2022 preceded major price recoveries. The pattern suggests that ETH may currently be trading below its fair value.
Ethereum (ETH) Price Breaks Out of Falling Wedge, Eyes $2,800 Target
In the 1-day chart for Ethereum (ETH/USDT), the price generated a bullish breakout from a falling wedge pattern. It typically signifies market reversal.
The prolonged downward trend inside reducing price action has resulted in ETH breaking through the wedge resistance level determined by the pattern.
The breakout signifies a potential market trend transition because the wedge pattern projects prices to move toward $2,800.

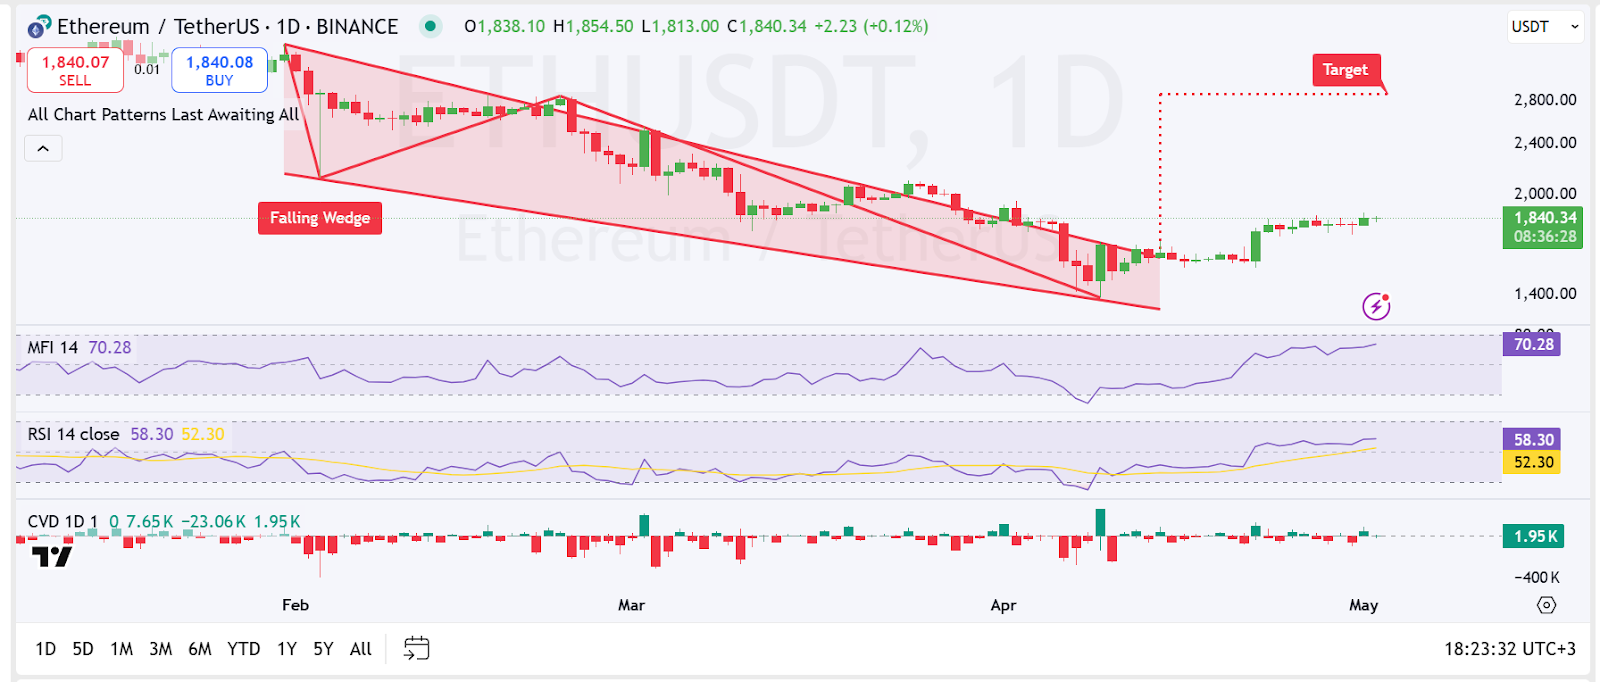
1-day Ethereum Trading Chart| Source: Trading View
The technical analysis signals indicated an uptrend potential at press time. MFI, along with RSI, suggested an ongoing bullish trend since both indicators showed a reading of 70.28 and 58.30, respectively. Cumulative Volume Delta (CVD) also showed positive buy-side activity.
Ethereum (ETH) maintained its position near $1,796.60 as it continued to push upward while creating higher highs combined with higher lows. That indicated a developing upward momentum for ETH price trend.
The bullish momentum can remain intact for an upward trend to $2,500 to $2,800 if ETH price maintains its position above $1,800.
Ethereum Sees Growing Institutional Interest Amid Bullish Long-Term Signals
Positive trends in Ethereum’s market direction become more substantial due to rising institutional interest.
The recent market consolidation phase demonstrated institutional support for Ethereum when Grayscale Investments bought $11.98 million in ETH as part of their long-term investment strategy.
The financial institution Fidelity invested $6.43 million in Ethereum through their Coinbase account. It demonstrates how major institutions keep strong confidence in the upcoming Ethereum (ETH) price increase.
Market participants continue to monitor technical resistance signals as Ethereum approaches the potential target of $8,000 during the final quarter of 2025 after the network utility sector gained momentum.


