


Ethereum’s price found stability within a narrow range, moving between $2,470 and $2,537 over the past day, as both oscillators and moving averages reflect neutral-to-bearish signals, indicating a pause in its short-term momentum.
Ethereum
The daily chart shows ethereum’s (ETH) recent trend of lower highs and lows, hinting at a bearish undertone. However, steady positioning around the $2,500 level could signal the formation of a potential base. Despite reaching $2,769 earlier in Oct., low trading volume currently suggests a reduction in selling activity. The relative strength index (RSI) is holding at a neutral 48.77, showing that ether is neither overbought nor oversold. Similarly, the commodity channel index (CCI) at -26.21 and the average directional index (ADX) at 19.15 both indicate limited momentum, reinforcing a quiet market environment. Key support is located between $2,400 and $2,500, while resistance may emerge between $2,700 and $2,750 if bullish pressure gains traction.
ETH/USD 4-hour chart.
On the 4-hour chart, recent minor rebounds lifted ethereum (ETH) back to the $2,500 level following a dip to $2,380. The Stochastic oscillator, at 31.45, remains neutral, indicating softened momentum and possible indecision in the market. Meanwhile, the moving average convergence divergence (MACD) at 2.10 shows a sell signal, hinting at weak upward movement and advising caution against potential downside. A breakout above $2,525 on the 4-hour timeframe, ideally supported by a volume boost, could lead to a short rally toward the $2,600-$2,620 resistance range, while a stop-loss at $2,450 may help manage risk on a downward move.

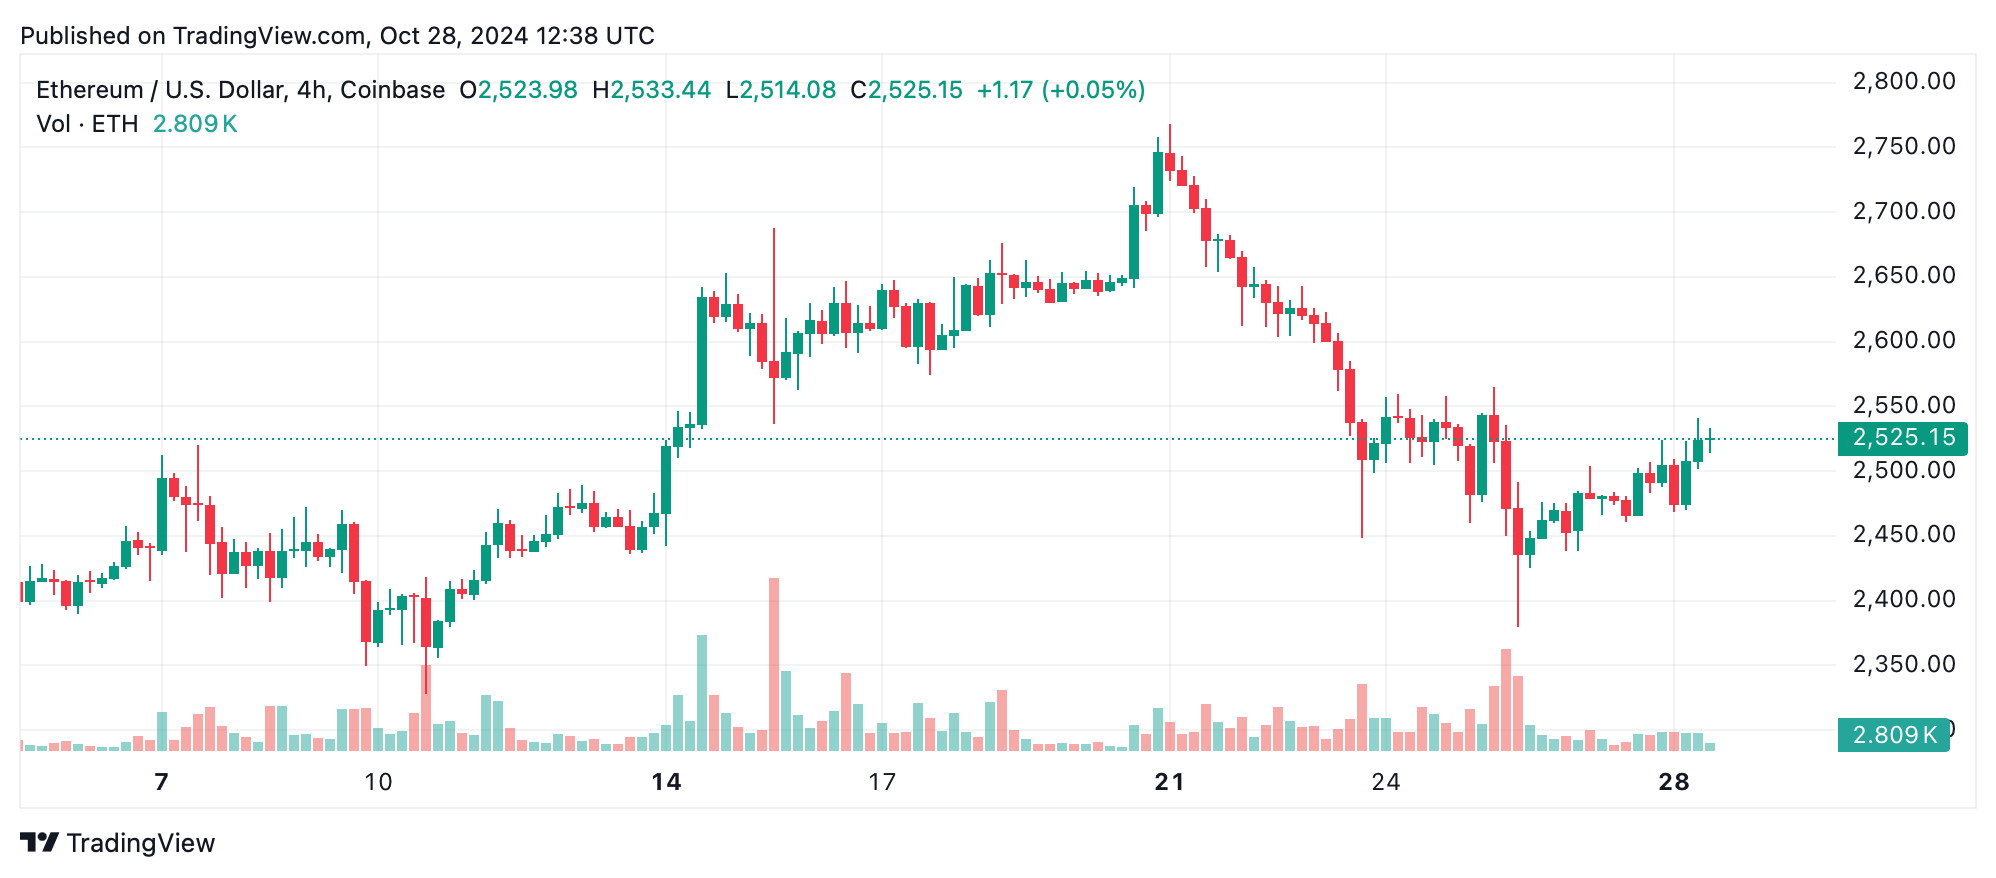
ETH/USD daily chart.
The 1-hour chart highlights recent resistance around $2,540, with ethereum facing intermittent selling pressure that suggests potential consolidation. Low volume at this level signals reduced trader commitment, and oscillators reflect similarly mixed momentum. Key support around $2,480 offers short-term stability, while the resistance between $2,540 and $2,550 poses a challenge. An entry at $2,540 with a close stop-loss around $2,480 could capture a minor upswing, with a target in the $2,560-$2,580 range if volume supports a push higher.
Moving averages (MAs) indicate a more bearish outlook across timeframes. The 10, 20, and 30-period exponential moving averages (EMAs) are all positioned below the current price, with the 10 EMA at $2,534.80 and the 30 EMA at $2,534.93, both suggesting sell signals. The longer-term 50 and 100-period EMAs, at $2,549.64 and $2,661.74 respectively, add to downside potential, as does the 200 EMA at $2,778.42. This bearish configuration suggests that ethereum faces considerable resistance to upward movement and may remain in consolidation unless it sees a breakout with strong volume support.
Bull Verdict:
A bullish scenario for ethereum depends on a breakout above the $2,550 level on both the 1-hour and 4-hour charts, ideally alongside rising trading volume to indicate buyer confidence. This would suggest enough momentum to push toward the $2,700 resistance zone, especially if oscillators flip to stronger buy signals and moving averages provide support.
Bear Verdict:
The bearish perspective is supported by the alignment of multiple sell signals across moving averages, signaling a challenging environment for sustained upward movement. If ethereum cannot hold support near $2,480, especially on the daily chart, it may see a retest of the $2,400 level. Such a scenario would deepen the current consolidation phase and likely extend the downtrend, encouraging a cautious approach for short-term positions.


")


