


On August 26, 2024, ethereum’s price hovered around the $2,739 mark, reflecting a cautious market sentiment as traders weigh the potential for further gains against looming resistance. Technical indicators across multiple timeframes reveal a mixed outlook, with key support and resistance levels tightly defining ethereum’s near-term trajectory.
Ethereum
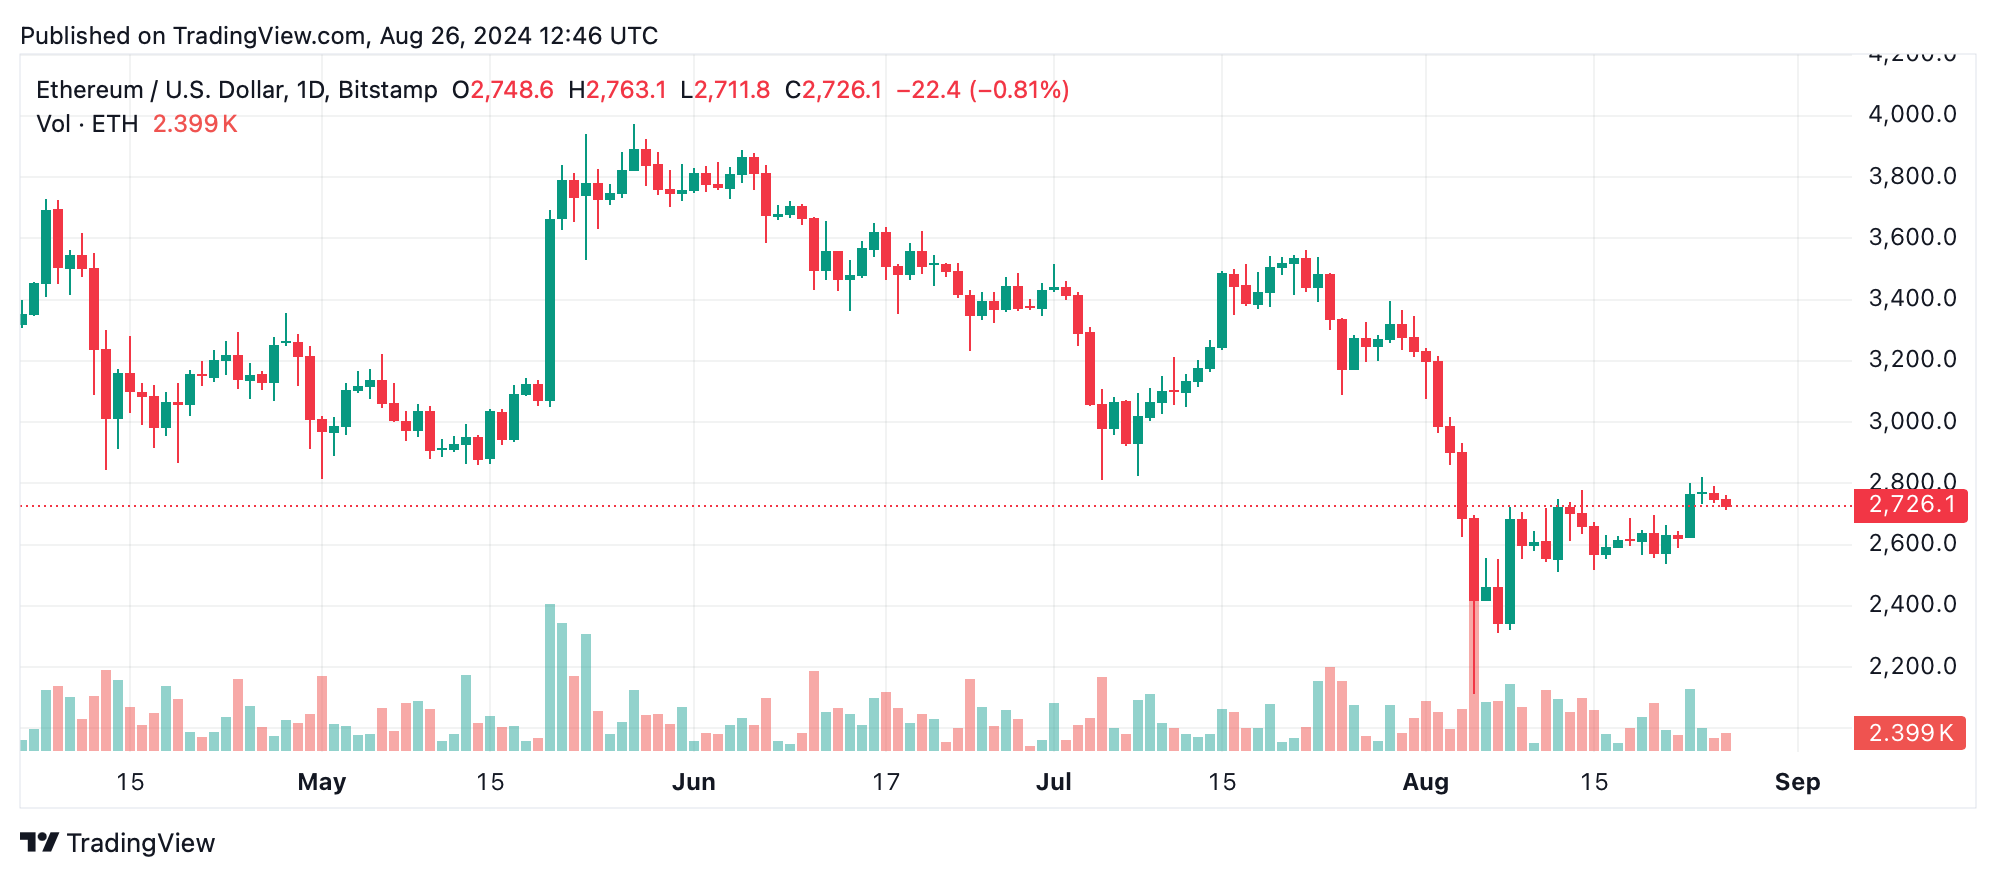
Ethereum’s daily chart shows a strong downtrend that dominated early August, with prices plummeting from $3,400 to a low of $2,017. This sharp decline has since been followed by a period of consolidation between $2,600 and $2,800. The volume has been mixed during this consolidation, suggesting a lack of clear direction among traders. Key support remains firm at $2,017, while the $2,800 resistance level continues to challenge upward momentum.
The 4-hour chart provides insight into a short-term uptrend that began around August 21, pushing ethereum’s price from $2,535 to a high of $2,823. However, this upward momentum has shown signs of weakening as the price stabilizes just below $2,800. The volume during this period was higher during the ascent but has since diminished, indicating reduced buying pressure as ethereum approaches critical resistance.

On the 1-hour chart, ethereum exhibits a range-bound behavior, with the price oscillating between $2,712.6 and $2,793.5. This pattern reflects the market’s indecision, as traders appear hesitant to push the price beyond these established levels. Volume spikes during the decline from $2,793.5 to $2,712.6 hint at selling pressure, though the overall volume remains subdued during the consolidation phase.
Oscillators reveal a mixed picture, with the relative strength index (RSI) at 48.4, indicating neutrality. The commodity channel index (CCI) at 115.2 suggests a potential sell signal, while the moving average convergence divergence (MACD) level of -62.7 points to a possible buy. Momentum indicators are similarly divided, with the awesome oscillator and Stochastic both neutral, reflecting the broader uncertainty in the market.
Finally, moving averages (MAs) present a complex scenario. Shorter-term averages, such as the 10-period exponential moving average (EMA) and simple moving average (SMA), signal buying opportunities, with prices currently above these averages. However, longer-term moving averages, including the 50, 100, and 200-period EMAs and SMAs, all suggest a bearish outlook, with prices trading below these averages. This divergence between short and long-term indicators underscores the tension in ethereum’s current market position.
Bull Verdict:
If ethereum manages to break through the $2,800 resistance with strong volume, it could signal the start of a new upward trend, potentially driving the price back toward the $3,000 level. Short-term indicators support a bullish outlook, especially if buying momentum increases.
Bear Verdict:
However, failure to breach the $2,800 resistance, coupled with the bearish signals from long-term moving averages, could lead to a retest of lower support levels around $2,600 or even $2,500. A breakdown below these supports could trigger further downside, reinforcing the bearish trend observed on the daily chart.


 Bull Run Canceled, Ethereum (ETH): Way to $2,000 Open")


