


XRP currently commands a valuation of $2.435, flaunting a market cap of $142 billion—once again eclipsing tether’s position. It boasts a 24-hour trading volume of $4.01 billion, representing 3.656% of Tuesday’s $109.654 billion crypto market activity, with intraday fluctuations between $2.41 and $2.52. Lingering 27% below its historic peak, the asset teeters between recovery and recalibration.
XRP
The 1-hour chart reveals a flicker of near-term optimism as XRP rebounded from $2.31, challenging $2.52 amid rising transactional zeal during upward price movements. Nestled within a pivotal $2.45–$2.48 corridor, the token hints at possible gains if this foothold endures. Yet the $2.52 ceiling looms; a reversal here might precipitate a retreat to $2.40. A decisive breach of $2.50 could propel it toward $2.55–$2.60, while faltering below $2.45 may invite transient liquidation.
XRP/USDT via Binance 1H chart on Feb. 11, 2025.
On the 4-hour chart, XRP stabilizes after a precipitous drop, etching a lateral channel between $2.3 and $2.5. Directional ambiguity persists as dwindling trade activity mirrors collective hesitation. A breakout above $2.5 might catalyze a climb to $2.6–$2.8, whereas sinking below $2.3 risks deeper depreciation. With resistance entrenched at $2.5, prudent traders await decisive signals before committing.

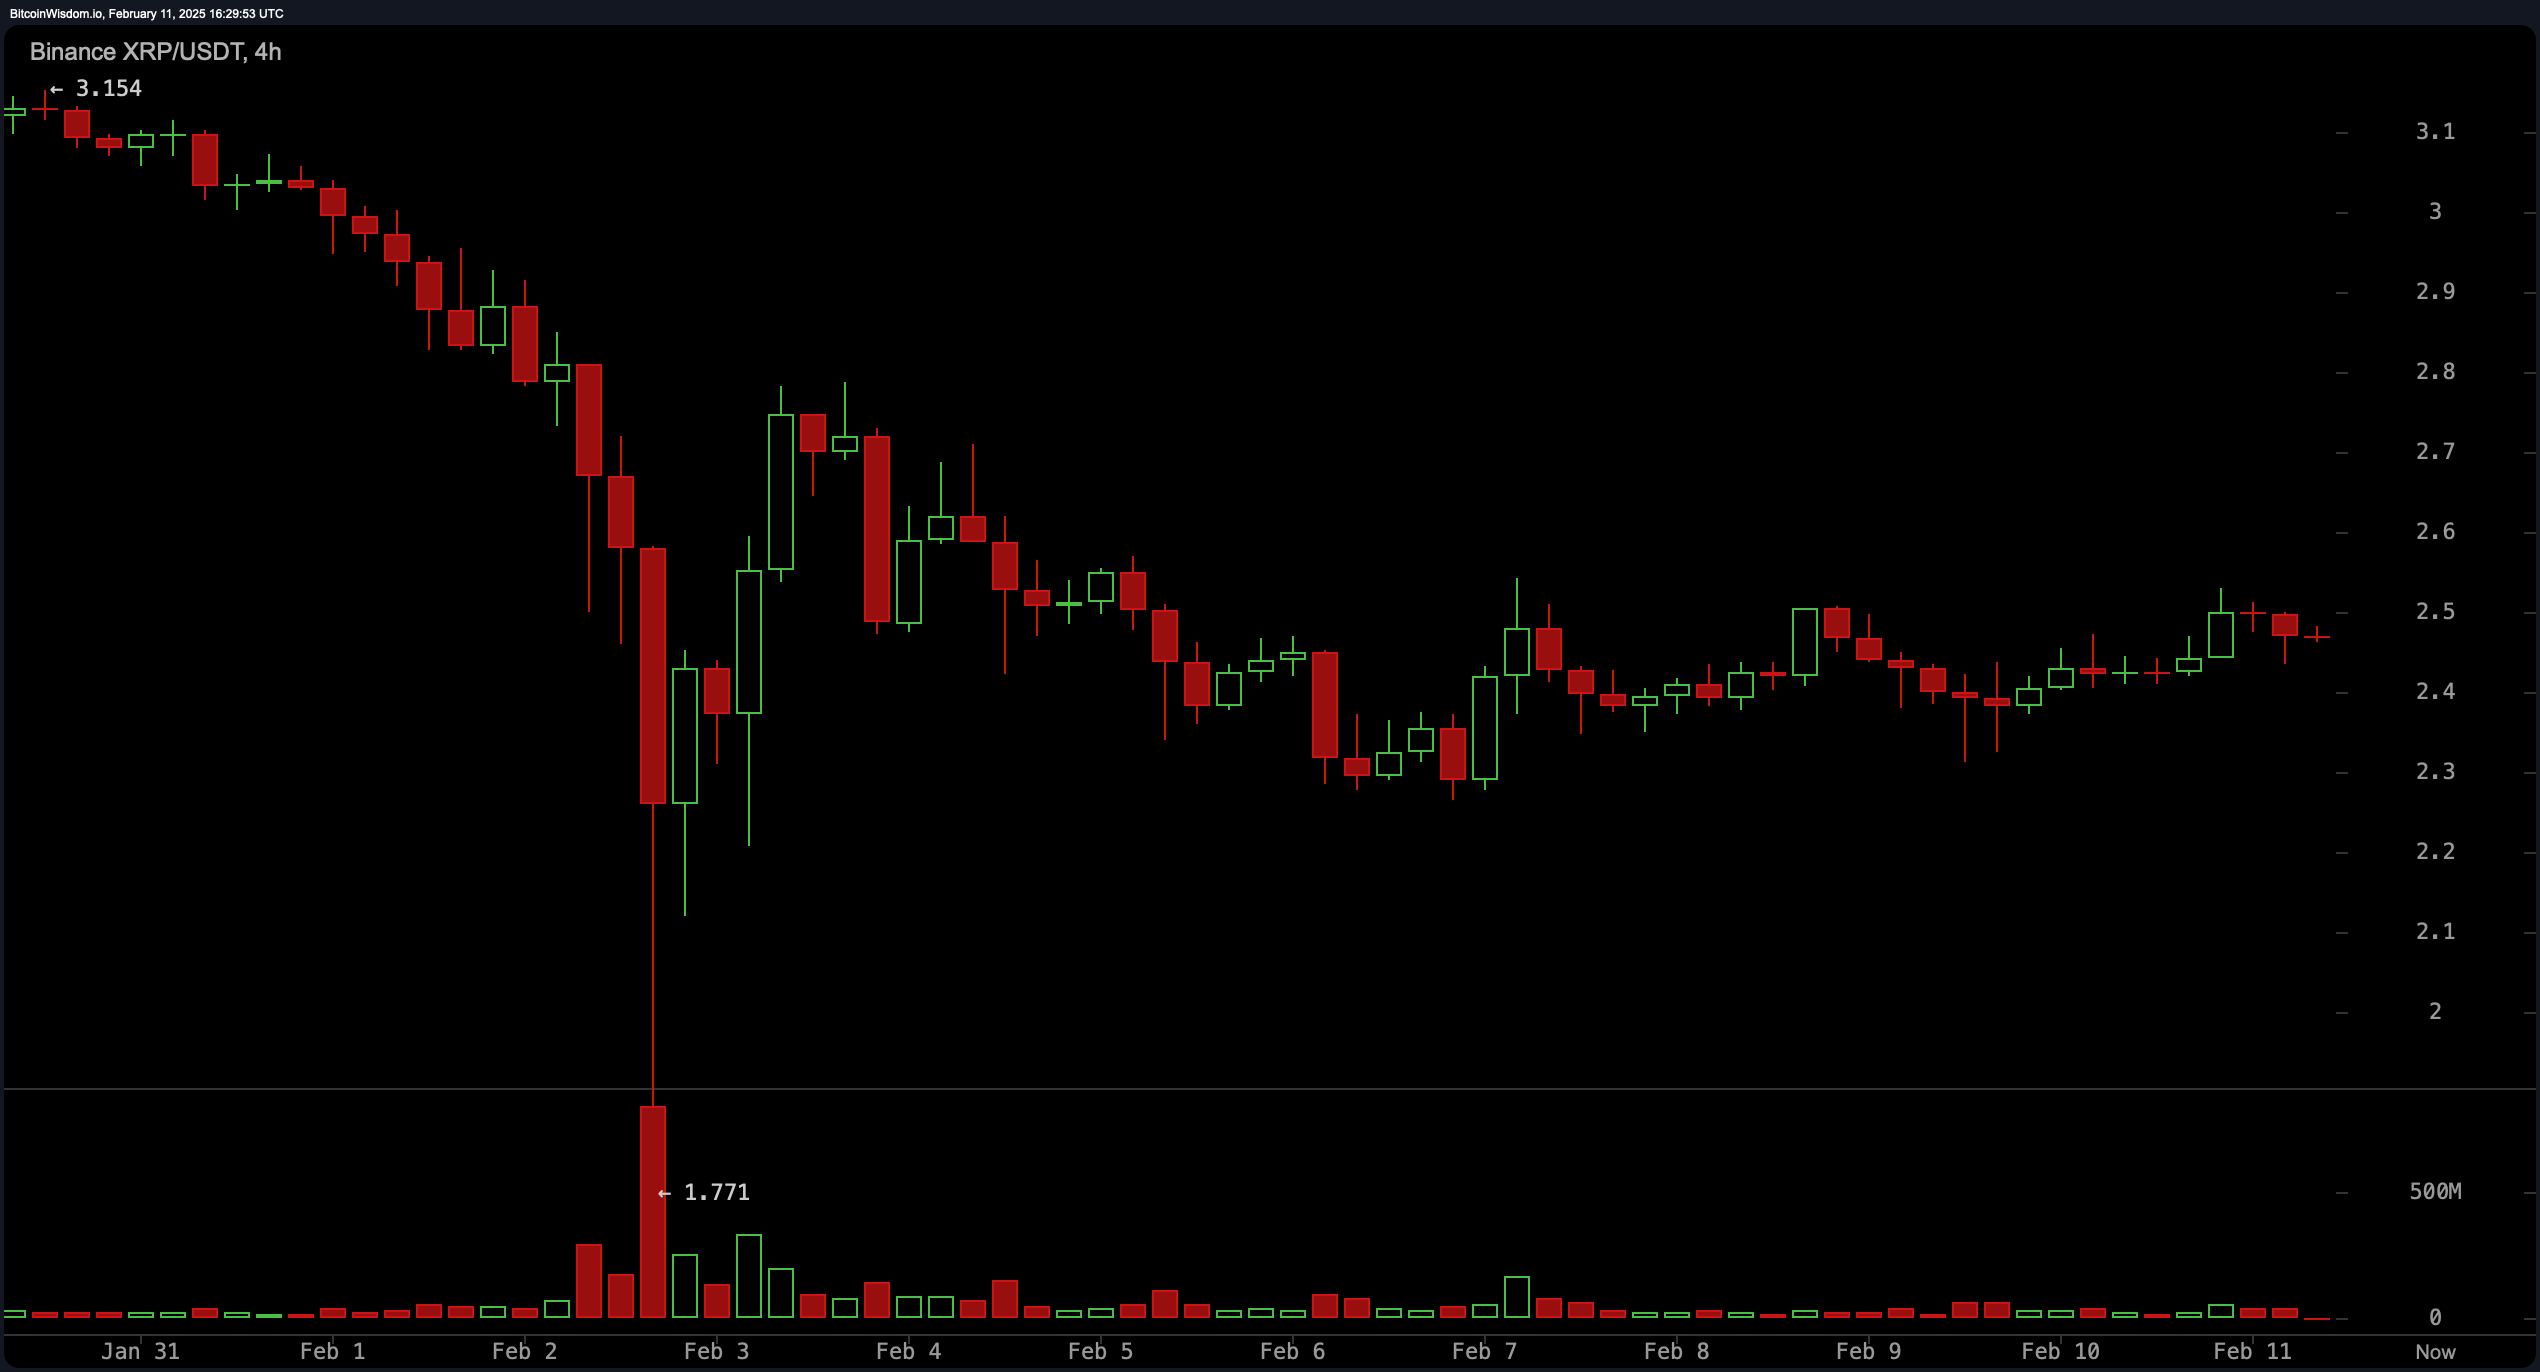
XRP/USDT via Binance 4H chart on Feb. 11, 2025.
The daily chart narrates a tale of ascent and abrupt reversal: XRP soared to $3.40 before succumbing to intense sell-offs, retreating to a $1.77 support base. Now oscillating between $2.4 and $2.6, its fate hangs on momentum. A sustained advance beyond $2.6 with vigorous participation could ignite a push toward $3.00, while failure to uphold $2.4 might foreshadow steeper declines.
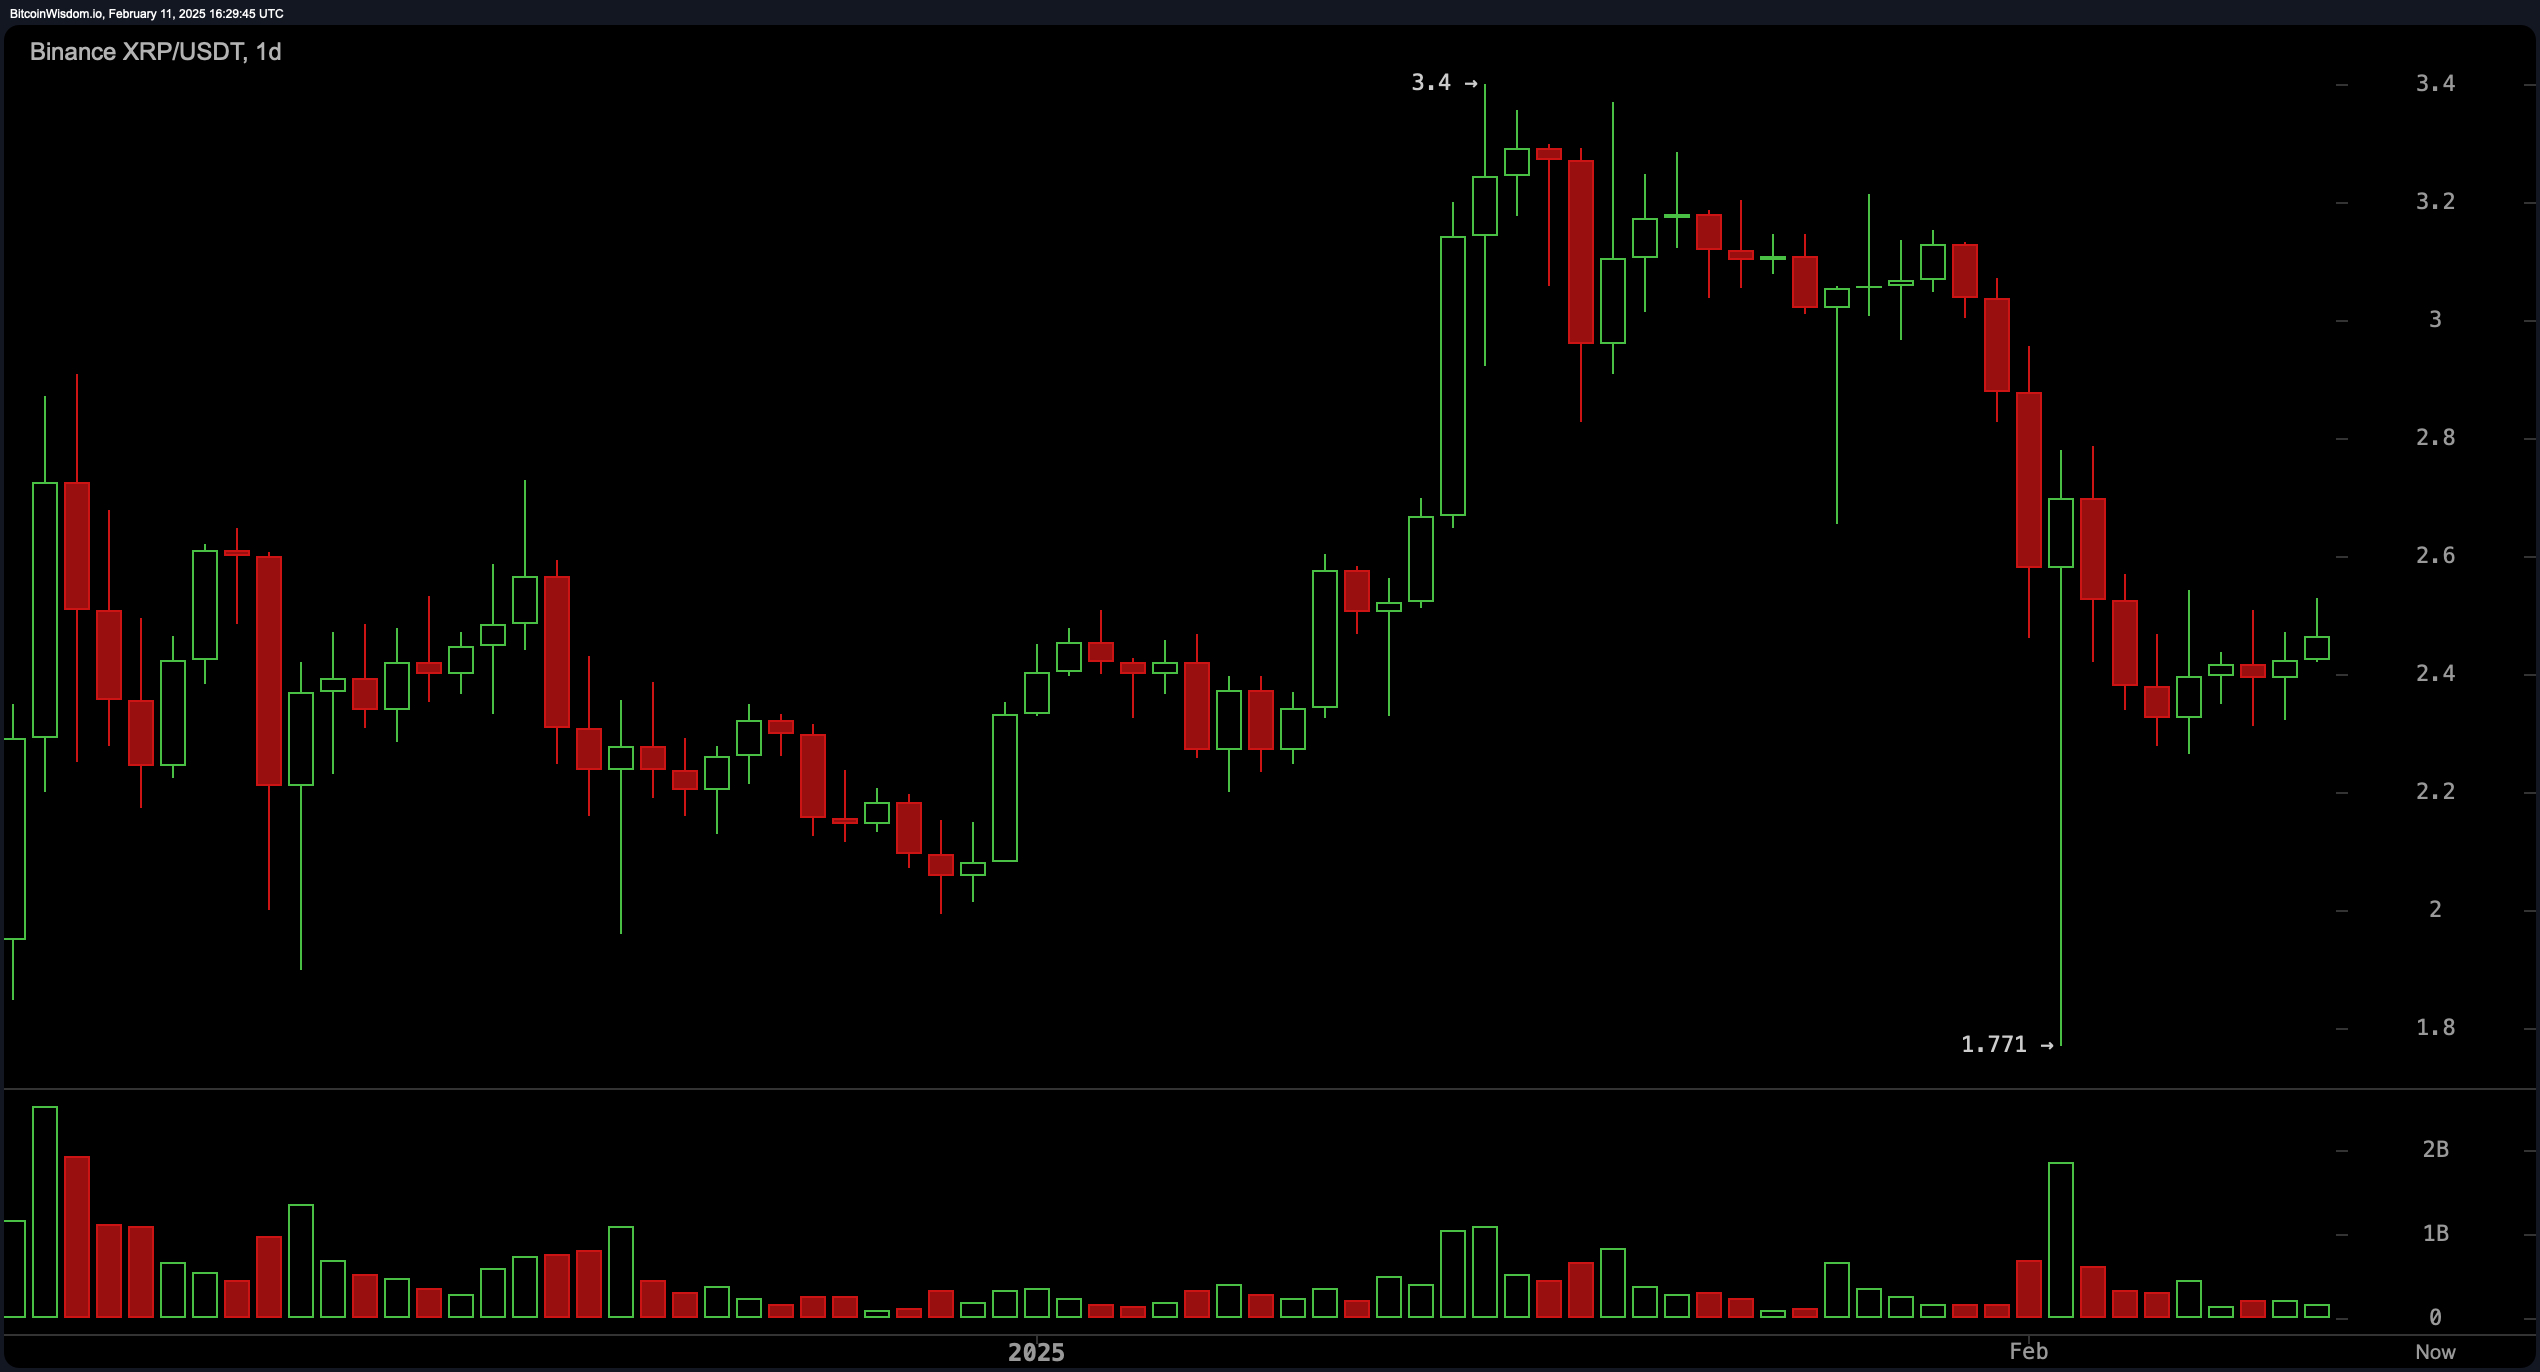
XRP/USDT via Binance 1D chart on Feb. 11, 2025.
Oscillators paint a balanced picture: the RSI sits at 41.16, stochastic %K at 46.30, CCI at -62.88, ADX at 35.43, and awesome oscillator at -0.36. Momentum registers a faintly optimistic -0.41, while the MACD’s -0.10 reading injects a note of caution, reflecting market ambivalence.
Moving averages offer divergent cues: shorter-term EMAs (10, 20, 30, 50) advise caution, while the 10-period SMA hints at accumulation. Extended horizons (100/200-period EMAs and SMAs) project optimism, suggesting XRP’s enduring vigor may outlast transient turbulence.
Bull Verdict:
XRP’s ability to hold above $2.45 and break through $2.6 with strong volume could confirm a bullish continuation toward $3.00 and beyond. The long-term moving averages indicate strength, and if buying pressure increases, XRP may regain momentum and push toward its previous highs.
Bear Verdict:
If XRP fails to sustain above $2.4 and breaks below $2.3, selling pressure could increase, leading to a decline toward $2.00 or lower. The bearish signals from the moving average convergence divergence (MACD) and short-term exponential moving averages suggest that without a decisive breakout, further downside remains a strong possibility.


 Price Targets $4,000 After Breaking Key Resistance Levels")


 ATH Is Incoming")


