


Celestia (TIA) crypto price is up over 6% in the last 24 hours. This surge marked a reversion following two days of consecutive fall and represents the third day of a cheerful trend for Celestia crypto.
TIA price has been laboring inside a falling wedge pattern and has continued to form the lower low swings. The $4 mark is TIA’s most crucial support level, as the altcoin retested it thrice and found support there.
The current market structure on the daily chart reflects a bearish view, though it shows signs of hope for bulls, as the token gained over 6% intraday.
The recent drop in TIA price is due to the upcoming token unlock event. According To TokenUnlocks, over 174 million tokens, worth more than $175 Million, will be unlocked on October 31.
These tokens will be distributed to seed investors, initial core contributors, Series A and B investors.
Typically, token unlocks lead to dilution by increasing the circulation of coins in the marketplace. In Celestia’s case, this will most probably impact the staking reward, which currently sits at 9.96%, according to StakingRewards.
Celestia Price Prediction: Can Bulls Break the $5 Wall?
TIA crypto continued to drift in the bearish tide and faced a massive decay of over 60% in the last three months. $5 is the key hurdle that bulls will seek to break.
At press time, TIA crypto was trading at $4.24, up over 5% in the last 24 hours with a trading volume change of over 60%, representing investor optimism.
TIA Price by TheCoinRepublic on TradingView.com
A closer look at the daily chart paints the bearish outlook, as TIA price trades below the key moving averages and struggles to flip the trend.
@RektProof, in his tweet, mentioned that TIA crypto has retested the $4 support zone thrice and could surge.
$TIA / $USD
Potential 3 tap here as price swept into demand post msb
Looking for a move to the highs#Celestia pic.twitter.com/tKSL7w8xGT
— RektProof. (@RektProof) September 11, 2024
For a significant reversal, bulls must close and break the $5 wall to trap the bear cartel.
Technical Indicators Data | Source: CoinAlyze
The Awesome Oscillator (AO) hovers below the zero line, illustrating weak momentum and a lack of strong directional bias.
The Chaikin Money Flow (CMF) reading is below the zero line, at -0.18, conveying a lack of capital inflows in the market.
However, the MACD indicator began to plot a green bar on the histogram, conveying a shift in market dynamics. The RSI line stayed below 50, the neutral zone, and indicates a lack of buying momentum.
In the recent sessions, the lack of buying pressure suggested that TIA might need help climbing past the $5 level.
Derivatives Data are Giving a Positive Signal
The derivatives data indicates that Open Interest (OI) rose 14.06% to $127.30 Million, defining long buildup activity in the past 24 hours.

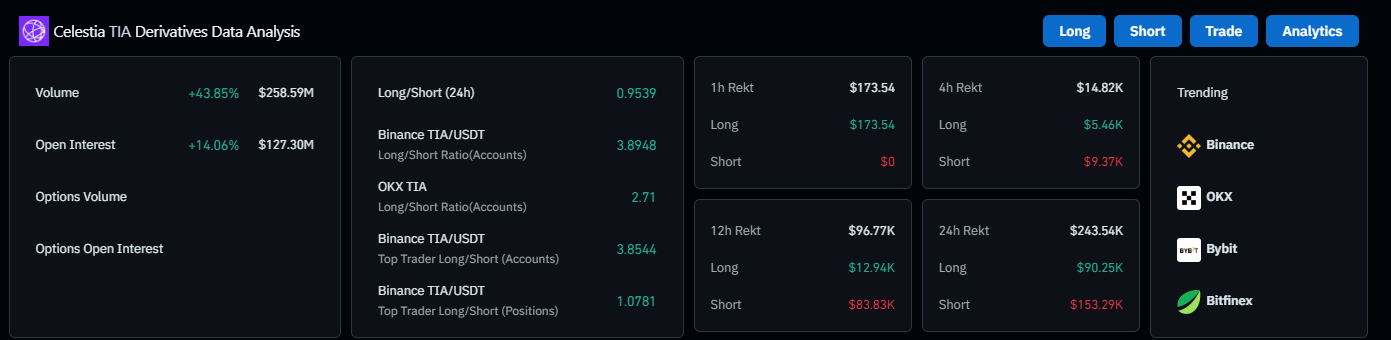
Derivatives Data | Source: Coinglass
However, the long/short ratio (24h) favored the long positions at 0.9539, indicating bullish sentiment among the traders and investors.
The immediate support levels were $4.20 and $3.80, whereas the resistance levels were $5 and $5.30.


 on Verge of Critical Downfall, Bitcoin (BTC) Eyeing $100,000, XRP: Sleeping or Skyrocketing?")
