


- Canadian Dollar went in both directions on Thursday’s mixed US data.
- Canada is absent from economic calendar until Friday’s GDP update.
- US PCE Price Index inflation also looms ahead on Friday.
The Canadian Dollar (CAD) gave a mixed performance on Thursday after a data-light economic calendar on the Canadian side left the CAD to twist amid a mixed print in key US figures. Markets are gearing up for Friday’s US Personal Consumption Expenditure Price Index (PCE) inflation release after Thursday’s burgeoning US release schedule ran the gamut.
Canada is absent from the economic calendar on Thursday, leaving CAD traders to shuffle in place until Friday’s Canadian Gross Domestic Product (GDP) update for April.
However, Friday’s US PCE Price Index inflation is set to eclipse Canadian GDP figures entirely. As a key reading of inflation for the Federal Reserve (Fed), significant market attention will be focused squarely on US price growth figures to cap off the trading week.
Daily digest market movers: US data comes in mixed, Canadian Dollar follows suit
- US Durable Goods Orders contracted in May, clocking in -0.1% MoM versus the forecast 0.2%, falling further than expected from the previous 0.4%.
- US Q1 GDP came in exactly as expected with first-quarter GDP slightly revised to 1.4% from the initial print of 1.3%.
- US Initial Jobless Claims beat expectations with 233K net new jobless benefits seekers for the week ended June 21. Median market forecasts had expected a print of 236K compared to the previous week’s 238K.
- US Core Personal Consumption Expenditures, a preview of Friday’s PCE Price Index, ticked upwards to 3.7% in the first quarter versus the expected hold at 3.6%.
- Friday’s Canadian MoM GDP in May is expected to rebound to 0.3% from the previous flat print.
- US core PCE Price Index inflation is expected to ease to 0.1% in May from the previous 0.2%.
Canadian Dollar PRICE Today
The table below shows the percentage change of Canadian Dollar (CAD) against listed major currencies today. Canadian Dollar was the strongest against the Swiss Franc.
| USD | EUR | GBP | JPY | CAD | AUD | NZD | CHF | |
|---|---|---|---|---|---|---|---|---|
| USD | -0.24% | -0.22% | -0.06% | -0.11% | -0.02% | -0.12% | 0.07% | |
| EUR | 0.24% | 0.00% | 0.15% | 0.11% | 0.23% | 0.09% | 0.31% | |
| GBP | 0.22% | -0.00% | 0.18% | 0.11% | 0.23% | 0.12% | 0.32% | |
| JPY | 0.06% | -0.15% | -0.18% | -0.05% | 0.04% | -0.09% | 0.15% | |
| CAD | 0.11% | -0.11% | -0.11% | 0.05% | 0.08% | -0.01% | 0.19% | |
| AUD | 0.02% | -0.23% | -0.23% | -0.04% | -0.08% | -0.10% | 0.08% | |
| NZD | 0.12% | -0.09% | -0.12% | 0.09% | 0.01% | 0.10% | 0.20% | |
| CHF | -0.07% | -0.31% | -0.32% | -0.15% | -0.19% | -0.08% | -0.20% |
The heat map shows percentage changes of major currencies against each other. The base currency is picked from the left column, while the quote currency is picked from the top row. For example, if you pick the Canadian Dollar from the left column and move along the horizontal line to the US Dollar, the percentage change displayed in the box will represent CAD (base)/USD (quote).
Technical analysis: Canadian Dollar churns on data-light Thursday, but gains remain thin
The Canadian Dollar (CAD) is mixed on Thursday, giving a middling performance in overall quiet markets. The CAD is up over a tenth of a percent against the Swiss Franc (CHF) and the Japanese Yen (JPY), but falling back a fifth of a percent against the Euro (EUR) and the Pound Sterling (GBP).
USD/CAD is stuck close to Thursday’s opening bids after an early dip to 1.3680. The pair remains stuck in a price action trap near the 1.3700 handle as intraday bids get hung up on the 200-hour Exponential Moving Average (EMA) at 1.3692.
Daily candlesticks are forming a bullish bounce after running aground of the 50-day EMA at 1.3676 and is set to snap a near-term losing streak after the pair flubbed a bullish recovery of the 1.3800 handle earlier in June.
USD/CAD hourly chart
USD/CAD daily chart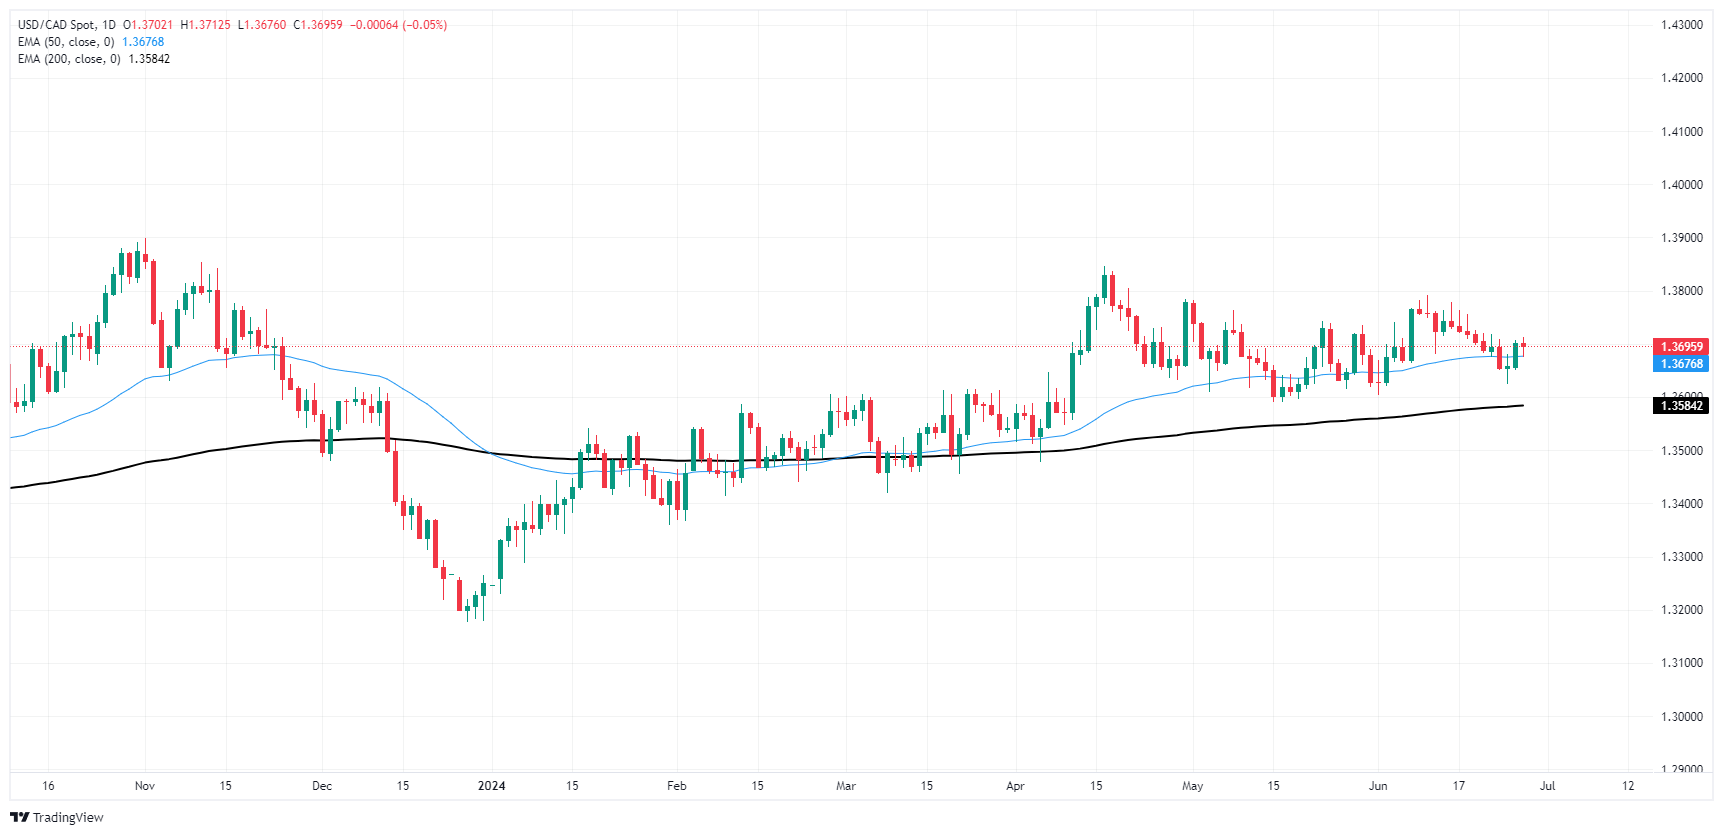

Economic Indicator
Gross Domestic Product (MoM)
The Gross Domestic Product (GDP), released by Statistics Canada on a monthly and quarterly basis, is a measure of the total value of all goods and services produced in Canada during a given period. The GDP is considered as the main measure of Canadian economic activity. The MoM reading compares economic activity in the reference month to the previous month. Generally, a high reading is seen as bullish for the Canadian Dollar (CAD), while a low reading is seen as bearish.


