


- Canadian Dollar easing but sticking to midrange.
- Canada Ivey PMI beat expectations in April.
- CAD markets wait for Friday’s Canadian labor data.
The Canadian Dollar (CAD) was broadly softer on Tuesday but stuck close to near-term technical levels as CAD markets shrugged off better-than-expected Ivey Purchasing Managers Index (PMI) figures from Canada. Markets await soundbites from Federal Reserve (Fed) policymakers as investors broadly focus on the Fed’s rate cut outlook.
Canada saw an improvement in the seasonally-adjusted Ivey PMI for April, signaling that business leaders in both the private and public sectors of Canada’s economy see an improvement in overall business activity. However, battered Crude Oil markets and floundering barrel prices limit the CAD’s ability to find higher ground.
Daily digest market movers: Upbeat Canadian PMIs fail to spark bullish interest
- Canada’s seasonally-adjusted Ivey PMI for April improved to 63.0 from 57.5, beating the forecast of 58.1.
- April’s Ivey PMI hit a two-year high, printing its highest activity survey result since May of 2022.
- Broader markets continue to focus on Fedspeak as investors hope for signs of rate cuts from the Fed.
- Thursday’s Financial System Review from the Bank of Canada (BoC) is widely expected to produce market moves.
- CAD traders looking out for Friday’s Canadian Net Change in Employment and Unemployment Rate numbers.
- Canada’s Net Change in Employment forecast to add net 20K jobs in April after the previous month’s -2.2K decline.
- The Canadian Unemployment Rate is expected to have increased to 6.2% in April, up slightly from the previous month’s 6.1%.
Canadian Dollar price today
The table below shows the percentage change of Canadian Dollar (CAD) against listed major currencies today. Canadian Dollar was the weakest against the Euro.
| USD | EUR | GBP | CAD | AUD | JPY | NZD | CHF | |
| USD | -0.07% | 0.13% | 0.20% | 0.17% | 0.15% | -0.09% | 0.00% | |
| EUR | 0.08% | 0.20% | 0.28% | 0.26% | 0.25% | -0.01% | 0.10% | |
| GBP | -0.12% | -0.20% | 0.09% | 0.08% | 0.06% | -0.20% | -0.09% | |
| CAD | -0.19% | -0.30% | -0.07% | -0.01% | -0.03% | -0.29% | -0.18% | |
| AUD | -0.17% | -0.26% | -0.06% | 0.01% | -0.01% | -0.28% | -0.16% | |
| JPY | -0.15% | -0.25% | -0.05% | 0.02% | 0.00% | -0.26% | -0.15% | |
| NZD | 0.11% | 0.01% | 0.23% | 0.29% | 0.29% | 0.26% | 0.12% | |
| CHF | -0.03% | -0.10% | 0.09% | 0.17% | 0.16% | 0.14% | -0.13% |
The heat map shows percentage changes of major currencies against each other. The base currency is picked from the left column, while the quote currency is picked from the top row. For example, if you pick the Euro from the left column and move along the horizontal line to the Japanese Yen, the percentage change displayed in the box will represent EUR (base)/JPY (quote).
Technical analysis: Canadian Dollar stubbornly swims in familiar circles
The Canadian Dollar (CAD) is broadly softer on Tuesday, giving up most of Monday’s early gains to trade into familiar bids. The CAD is flat to down across the board, shedding around a third of a percent against the New Zealand Dollar (NZD) and the Euro (EUR). The CAD is also down around a quarter of a percent against the US Dollar (USD).
USD/CAD rose into touching range of the 1.3700 handle on Tuesday with the CAD shrugging off Monday’s slim gains. The pair is trading into congestion near the 200-hour Exponential Moving Average (EMA) at 1.3697, and the Canadian Dollar has leaked away most of the gains found after last Friday’s US Nonfarm Payrolls (NFP) print dragged the pair down to 1.3610.
Daily candlesticks show USD/CAD finding near-term technical support from the 50-day EMA at 1.3629, with long-term bullish pressure from the 200-day EMA at 1.3552. The pair is still down from mid-April’s peak near 1.3850, but USD/CAD is still trading higher for the year, up 3.4% from January’s opening bids near 1.3250.
USD/CAD hourly chart
USD/CAD daily chart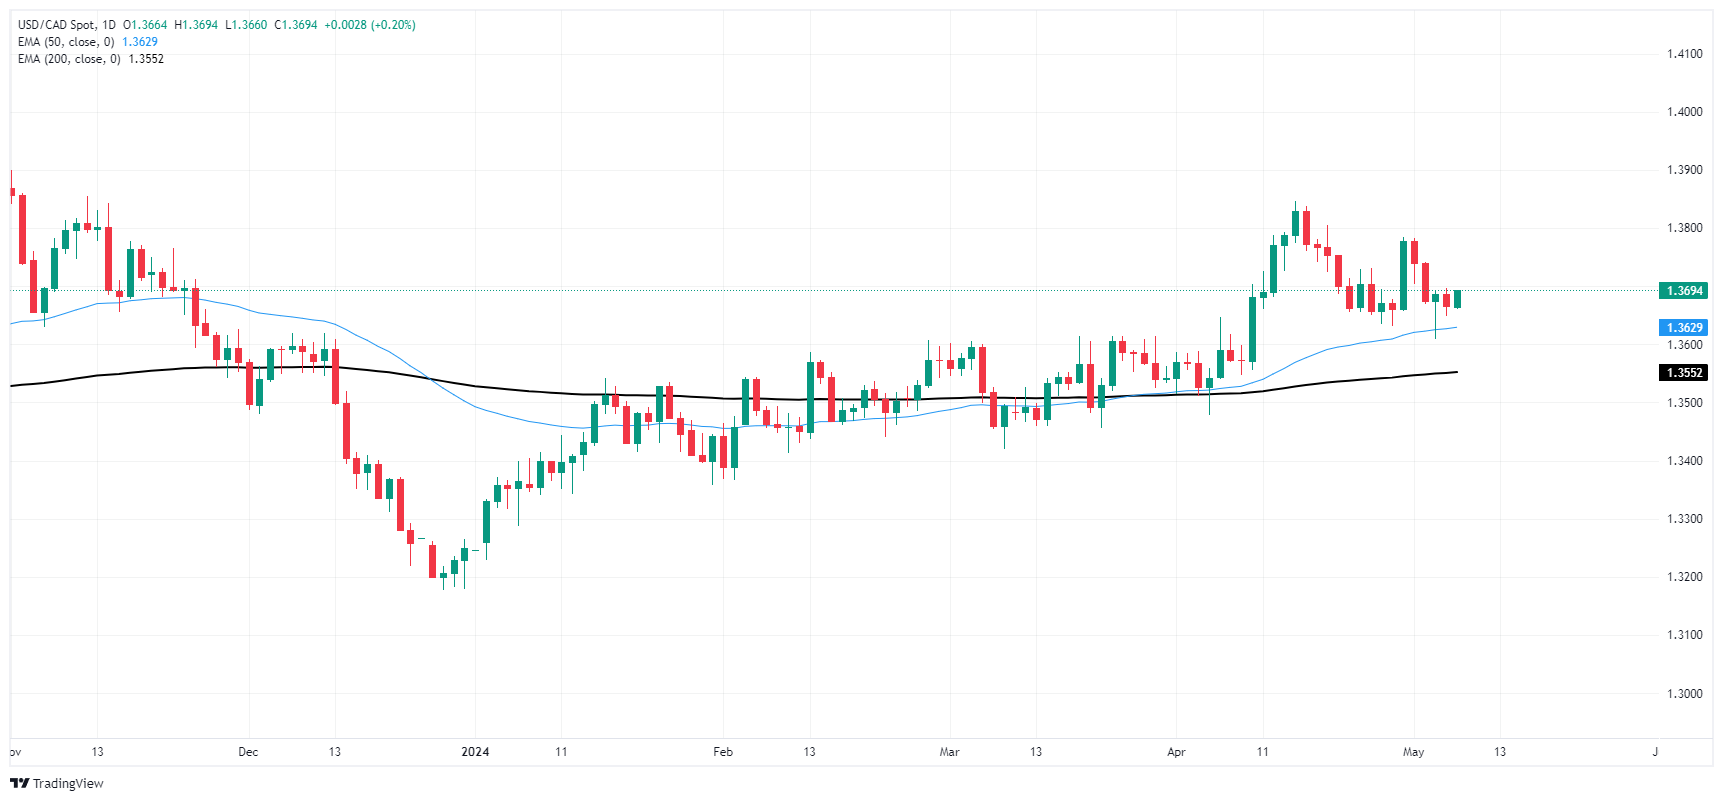

Risk sentiment FAQs
In the world of financial jargon the two widely used terms “risk-on” and “risk off” refer to the level of risk that investors are willing to stomach during the period referenced. In a “risk-on” market, investors are optimistic about the future and more willing to buy risky assets. In a “risk-off” market investors start to ‘play it safe’ because they are worried about the future, and therefore buy less risky assets that are more certain of bringing a return, even if it is relatively modest.
Typically, during periods of “risk-on”, stock markets will rise, most commodities – except Gold – will also gain in value, since they benefit from a positive growth outlook. The currencies of nations that are heavy commodity exporters strengthen because of increased demand, and Cryptocurrencies rise. In a “risk-off” market, Bonds go up – especially major government Bonds – Gold shines, and safe-haven currencies such as the Japanese Yen, Swiss Franc and US Dollar all benefit.
The Australian Dollar (AUD), the Canadian Dollar (CAD), the New Zealand Dollar (NZD) and minor FX like the Ruble (RUB) and the South African Rand (ZAR), all tend to rise in markets that are “risk-on”. This is because the economies of these currencies are heavily reliant on commodity exports for growth, and commodities tend to rise in price during risk-on periods. This is because investors foresee greater demand for raw materials in the future due to heightened economic activity.
The major currencies that tend to rise during periods of “risk-off” are the US Dollar (USD), the Japanese Yen (JPY) and the Swiss Franc (CHF). The US Dollar, because it is the world’s reserve currency, and because in times of crisis investors buy US government debt, which is seen as safe because the largest economy in the world is unlikely to default. The Yen, from increased demand for Japanese government bonds, because a high proportion are held by domestic investors who are unlikely to dump them – even in a crisis. The Swiss Franc, because strict Swiss banking laws offer investors enhanced capital protection.


