


- Canadian Dollar sheds half of a percent against the Greenback.
- Canada Day holiday leaves CAD markets in the dark for Monday.
- Canadian data remains limited this week until NFP Friday.
The Canadian Dollar (CAD) broadly retreated on Monday, as Canadian markets were dark for the Canada Day long weekend. CAD traders will be returning to the fold on Tuesday just in time for a fresh print of Canadian S&P Global Manufacturing Purchasing Managers Index (PMI) figures.
Canada has a largely empty dance card on this week’s economic calendar. Outside of Tuesday’s upcoming PMI print, little of note comes from the Canadian side until Friday’s labor figures, which will largely get drowned out by another round of US Nonfarm Payrolls (NFP).
Daily digest market movers: Canadian holiday leaves the CAD adrift
- Safe haven bids have broadly bolstered the US Dollar on Monday.
- Canadian Dollar takes pride of place as the single worst-performing major currency to kick off the new trading week.
- US ISM Manufacturing PMI figures for June printed worse than expected, backsliding to 48.5 from 48.7, missing the forecast uptick to 49.1.
- US ISM Manufacturing Price Paid, a measure of industry-level inflation expectations, retreated sharply in June, falling to 52.1 from 57.0, a far steeper drop than the forecast 55.9.
- Recession jitters are crimping risk appetite on Monday as wobbly US data prints tilt further into slowdown territory.
Canadian Dollar PRICE Today
The table below shows the percentage change of Canadian Dollar (CAD) against listed major currencies today. Canadian Dollar was the strongest against the Swiss Franc.
| USD | EUR | GBP | JPY | CAD | AUD | NZD | CHF | |
|---|---|---|---|---|---|---|---|---|
| USD | -0.15% | -0.08% | 0.45% | 0.46% | 0.20% | 0.37% | 0.60% | |
| EUR | 0.15% | -0.14% | 0.31% | 0.31% | 0.24% | 0.21% | 0.45% | |
| GBP | 0.08% | 0.14% | 0.43% | 0.47% | 0.39% | 0.36% | 0.61% | |
| JPY | -0.45% | -0.31% | -0.43% | 0.00% | -0.19% | -0.09% | 0.18% | |
| CAD | -0.46% | -0.31% | -0.47% | -0.01% | -0.22% | -0.10% | 0.14% | |
| AUD | -0.20% | -0.24% | -0.39% | 0.19% | 0.22% | -0.03% | 0.29% | |
| NZD | -0.37% | -0.21% | -0.36% | 0.09% | 0.10% | 0.03% | 0.27% | |
| CHF | -0.60% | -0.45% | -0.61% | -0.18% | -0.14% | -0.29% | -0.27% |
The heat map shows percentage changes of major currencies against each other. The base currency is picked from the left column, while the quote currency is picked from the top row. For example, if you pick the Canadian Dollar from the left column and move along the horizontal line to the US Dollar, the percentage change displayed in the box will represent CAD (base)/USD (quote).
Technical analysis: Canadian Dollar falls across the board, USD/CAD finds fresh highs
The Canadian Dollar (CAD) tumbled across the board on Monday, shedding around one-half of one percent against the US Dollar, Australian Dollar, and Pound Sterling. The CAD also shed a fifth of a percent against the Australian Dollar and around one-tenth of one percent against the Japanese Yen.
USD/CAD found a fresh multi-week high after testing into 1.3750 on Monday. The pair has recovered ground after bouncing from last week’s plunge below 1.3630. Still, intraday price action continues to trade on the rough side as the pair cycles the 200-hour Exponential Moving Average (EMA).
Daily candlesticks continue to find a foothold above the 50-day EMA at 1.3679, but bidding pressure will still need to gather enough steam to break north of June’s peak bids just shy of the 1.3800 handle.
USD/CAD hourly chart
USD/CAD daily chart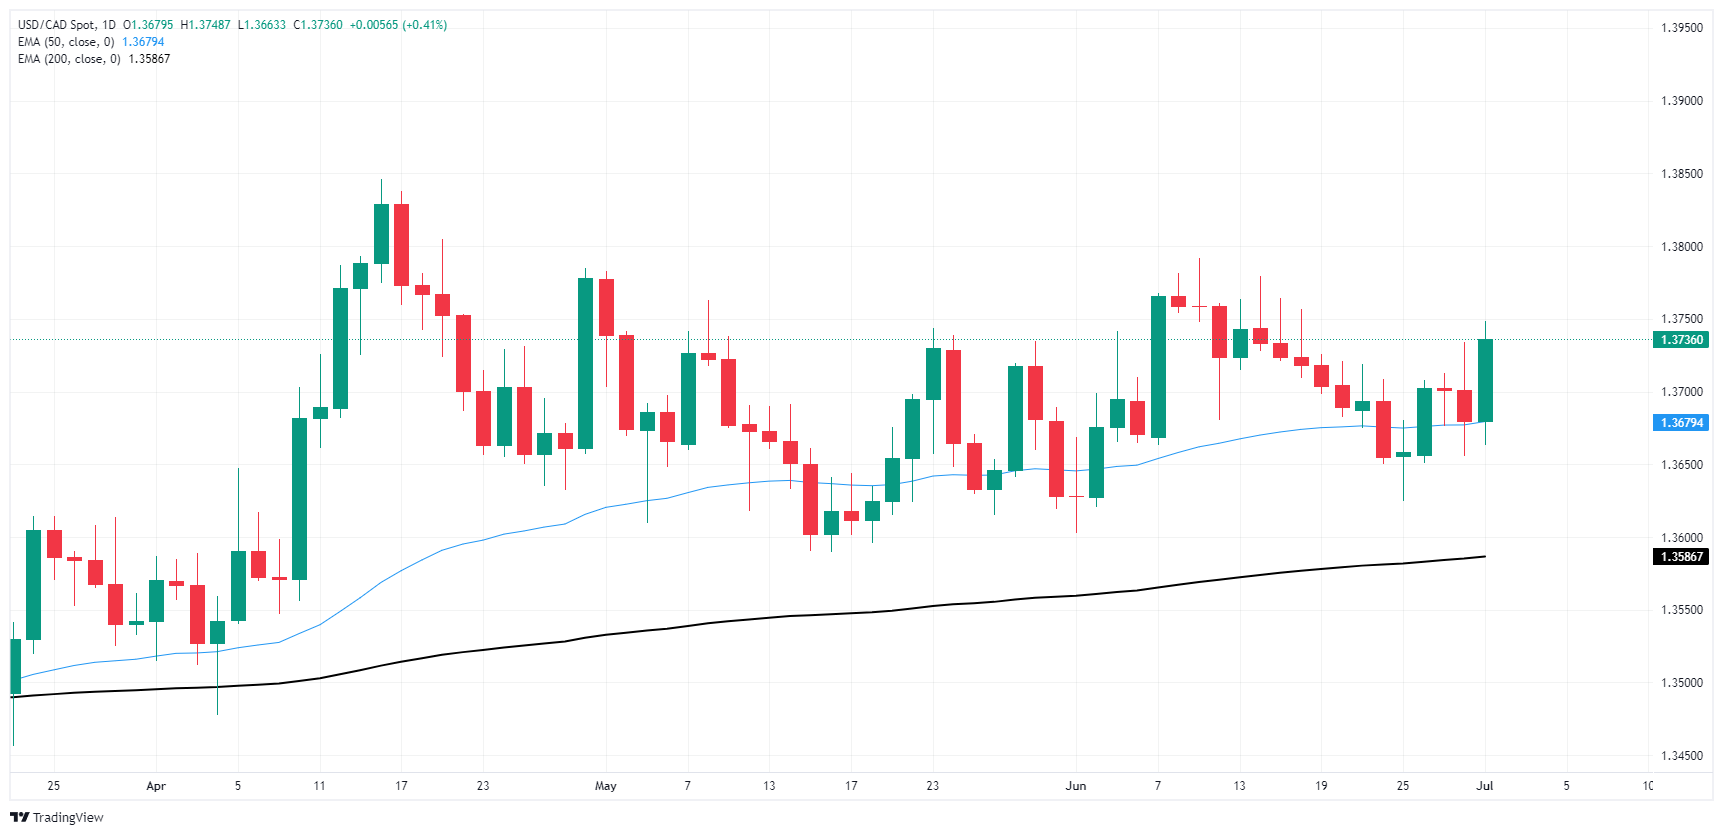

Economic Indicator
ISM Manufacturing Prices Paid
The Institute for Supply Management (ISM) Manufacturing Index shows business conditions in the US manufacturing sector, taking into account expectations for future production, new orders, inventories, employment and deliveries. It is a significant indicator of the overall economic condition in US. The ISM Prices Paid represents business sentiment regarding future inflation. A high reading is seen as positive for the USD, while a low reading is seen as negative.


