


Bitcoin’s price oscillation between $66,182 and $69,199 within 24 hours underscores a battlefield where bulls and bears vie for dominance.
Bitcoin
Bitcoin’s 1-day chart reveals a narrative of volatility, with the asset’s price making significant leaps and bounds. This volatility is encapsulated by long wick candles, highlighting the intense tug-of-war between buyers pushing upwards and sellers pulling down. A bullish pattern or a close above preceding highs might serve as a beacon for entry, while bearish signs or a drop below recent consolidation lows could indicate a timely exit.
BTC/USD daily.
Zooming into the 4-hour chart offers a granular view of bitcoin’s price action, revealing patterns of consolidation interspersed with attempts at breaking out. The resilience of the support level around $64,511 stands out, hinting at a strong base that buyers are keen to defend. Conversely, a break below this support, marked by significant volume, may suggest a shift in the balance towards the bears, prompting considerations for exit.

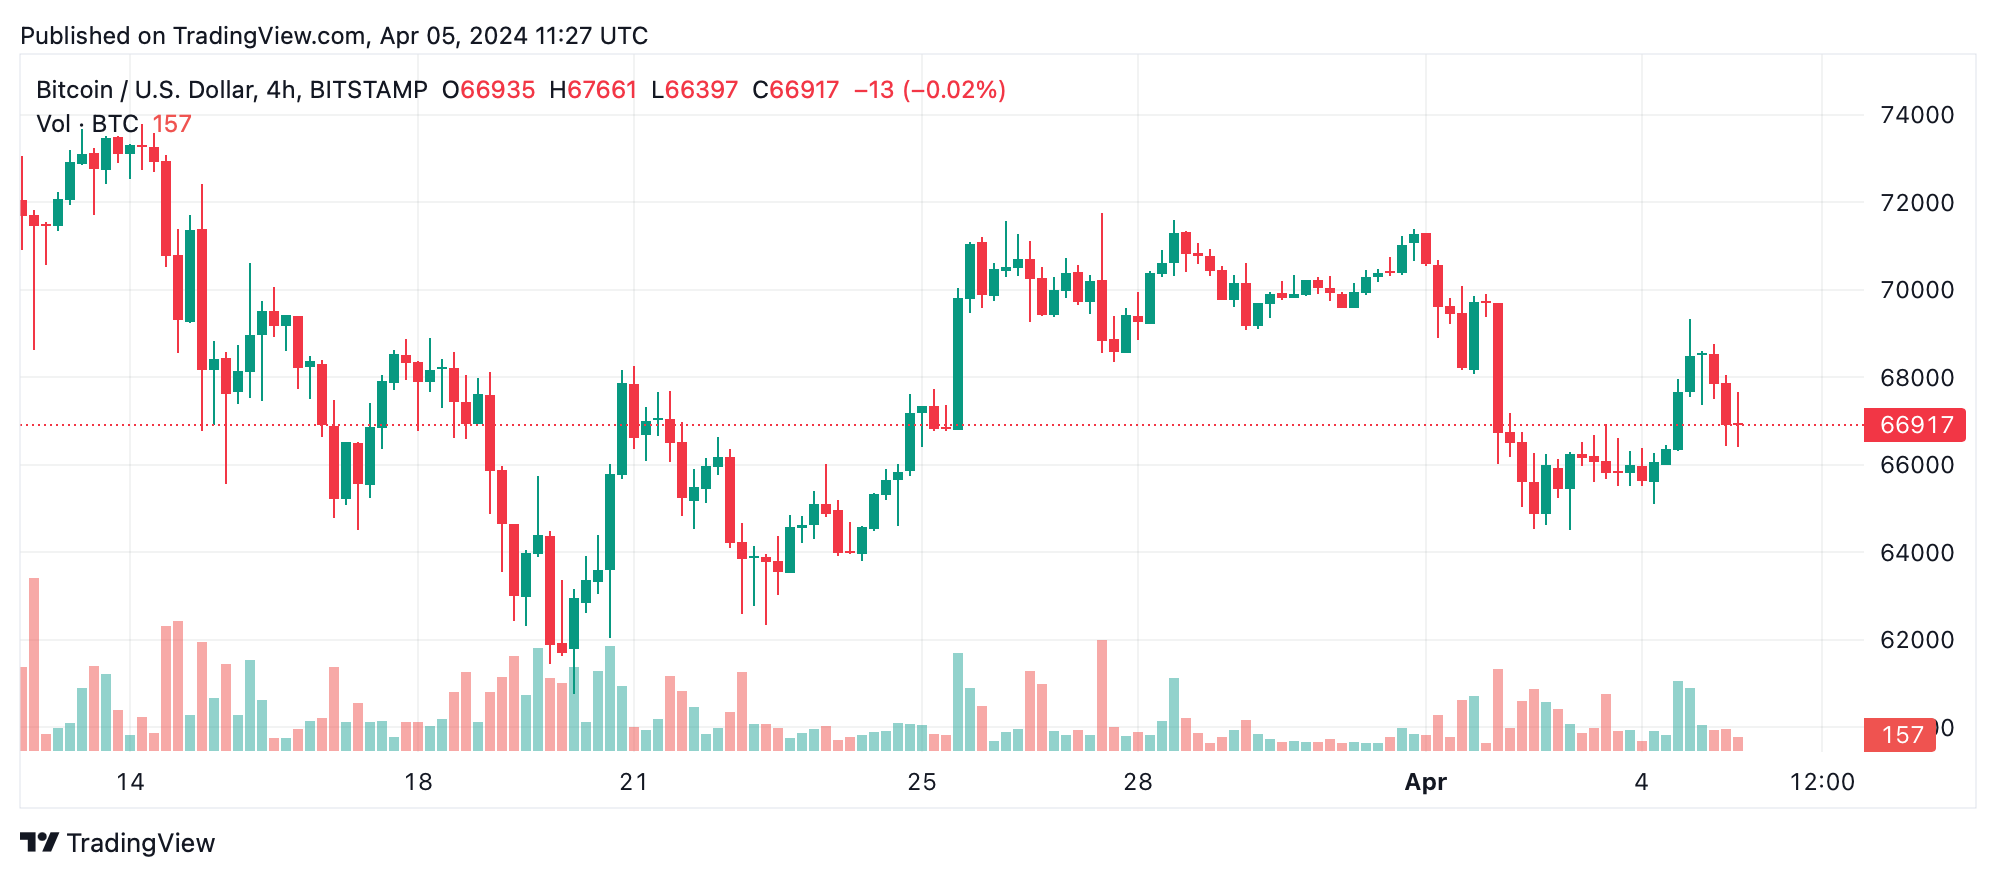
BTC/USD 4-hour.
The 1-hour chart provides an immediate snapshot of bitcoin’s price fluctuations, illustrating a slight downward trend and emerging resistance levels. Entry opportunities might be gleaned from clear indicators of trend reversal, such as the formation of higher highs and lows, possibly corroborated by moving averages.
The mixed signals from various oscillators, with the Relative Strength Index (RSI), Stochastic, and commodity channel index (CCI) hovering in neutral territory, contrast starkly against the bearish signals from the awesome oscillator, momentum, and moving average convergence divergence (MACD) level. This divergence suggests a market in flux, where decisive movement is yet to be established. Traders should navigate this landscape with a balanced perspective, weighing the sell indicators against the broader market context.
The story told by moving averages (MAs) is one of nuanced contrast. Shorter-term averages advocate for caution, signaling sell, while longer-term averages paint a picture of underlying strength with buy signals. This dichotomy reflects a market that, despite immediate pressures, holds a foundation of long-term optimism. The interplay between these averages can offer strategic insights into entry and exit points, guiding decisions with a blend of short-term caution and long-term confidence.
Bull Verdict:
In analyzing the confluence of technical indicators, particularly the strength shown in the longer-term moving averages and the resilience of key support levels on the 4-hour chart, the outlook for bitcoin on April 5, 2024, skews towards bullish. The undercurrents suggest that, despite short-term volatility and neutral oscillator readings, the foundational support and emerging patterns indicate a market gearing up for an upward trajectory.
Bear Verdict:
Conversely, a detailed examination of the current state of bitcoin, taking into account the sell signals from several key oscillators and the immediate-term moving averages, paints a cautionary picture. The neutrality of certain oscillators, juxtaposed with the active sell signals from the awesome oscillator, momentum, and MACD level, signals underlying market hesitancy and potential downward pressure.


