


- Bitcoin price broke above its key resistance level after facing multiple rejections the previous week.
- Ethereum’s price approaches the psychologically important level of $1,700; a breakout suggests a rally ahead.
- XRP stabilizes around $2.11 after failing to close above the $2.23 resistance level last week.
Bitcoin’s (BTC) price broke above its key resistance level after facing multiple rejections around it the previous week. Ethereum (ETH) and Ripple (XRP) prices are approaching their key resistance levels; a breakout could signal a rally ahead.
Bitcoin shows strength as it breaks above its $85,000 resistance level
Bitcoin price has faced multiple rejections around its 200-day Exponential Moving Average (EMA) at $85,000 since April 13. At Monday’s start of this week, BTC finally broke above the $87,000 resistance level.
If BTC continues its upward momentum, it could extend the rally to the key psychological level of $90,000. A successful close above this level could extend an additional rally to test its March 2 high of $95,000.
The Relative Strength Index (RSI) on the daily chart reads 57, indicating bullish momentum, as it is positioned above its neutral level of 50.
BTC/USDT daily chart
However, if BTC declines, it could find support around its key level of $85,000.
Ethereum price could recover further if it closes above $1,700
Ethereum price was rejected around the $1,700 level at the start of the previous week but recovered slightly during the second half. At the time of writing on Monday, it trades at around $1,640, approaching the $1,700 resistance level.
If ETH continues its recovery and closes above $1,700, it could extend the rally to retest its next daily resistance at $1,861.
The RSI on the daily chart reads 44 and points upward toward its neutral level of 50, indicating fading bearish momentum. The RSI must move above its neutral level of 50 for the bullish momentum to be sustained.
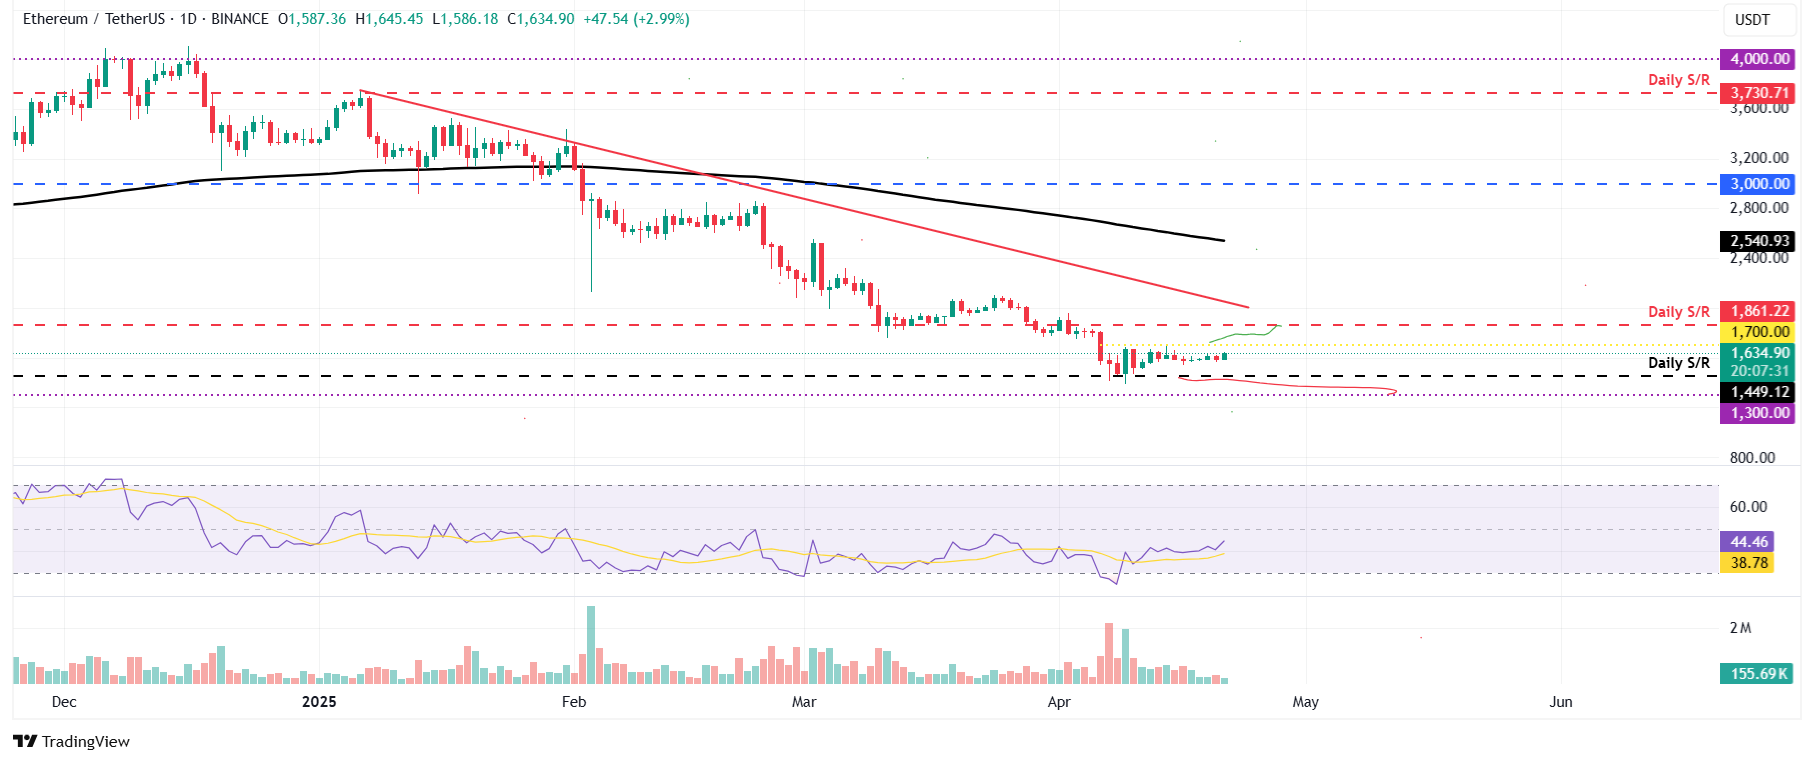

ETH/USDT daily chart
On the other hand, if ETH continues its correction, it could extend the losses to retest its daily support level at $1,449.
XRP could target $3.00 if it closes above its resistance level of $2.23
XRP faced rejection around the daily level of $2.23 on April 13 and declined 3.75% last week. At the time of writing on Monday, it hovers the $2.11 level.
If XRP breaks and closes above $2.23, it could extend the rally to retest its March 24 high of $2.50 before $3.00.
The RSI on the daily chart reads 49, around its neutral level of 50, indicating fading bearish momentum. The RSI must move above its neutral level of 50 for the bullish momentum to be sustained.
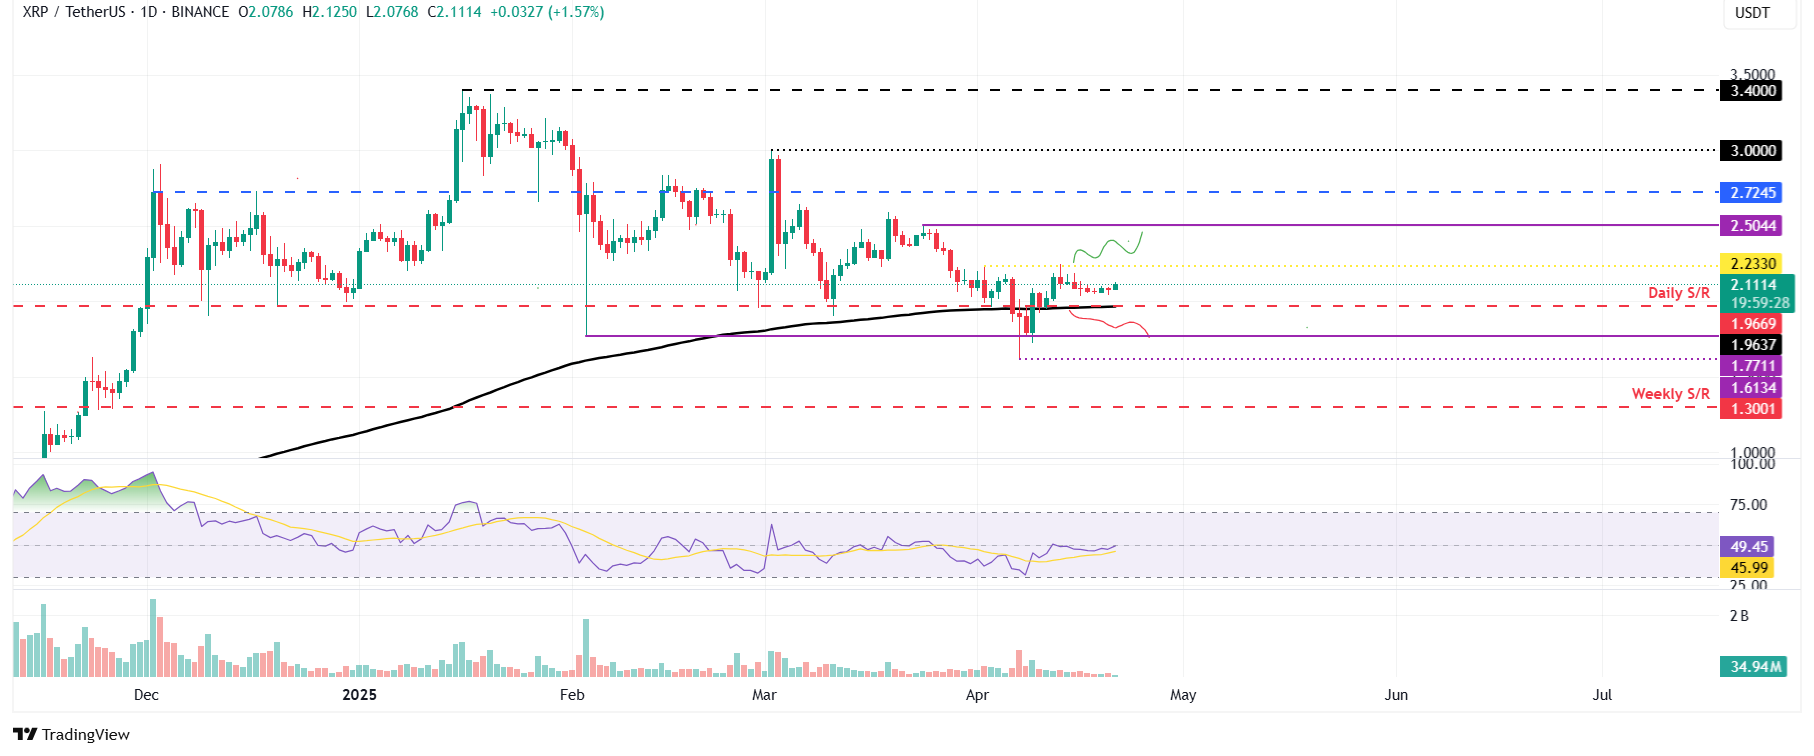

XRP/USDT daily chart
However, if XRP continues its decline and closes below its 200-day EMA, it could extend the decline to retest its next support level at $1.77.
Share: Cryptos feed


