


Bitcoin bulls have again reignited momentum in the BTC market over the weekend, propelling its value upward by over 2% and pushing it back into the $68,000 range. This bullish resurgence follows a sharp dip to $65.5K on Friday, marking a pivotal turn after a brief period of bearish pressure. Now, with sentiment shifting in favor of the bulls, eyes are on the $70,000 resistance level, where a possible new all-time high may lie within reach.
BTC Price Action
CoinMarketCap data reveals a transition in the cryptocurrency’s price action over the past 24 hours, as bearish pressure gave way to bullish dominance. After dipping to test support at approximately $66.8K, the token rebounded decisively, overcoming resistance levels and showing steady upward momentum. Currently trading at $68.12K, the cryptocurrency has gained 1.61% in a single day, reinforcing bullish optimism.
Strengthening this rally, the token’s market cap surged to $1.35 trillion, reaffirming its stature as the leading digital asset. However, its trading volume paints a more cautious picture, with a 24.45% drop to $16.50 billion in the past 24 hours. This dip suggests some investors may be adopting a wait-and-see approach, potentially holding off for a confirmed breakout above key resistance points.
Technical Indicators Signal Bullish Prospect
The cryptocurrency’s daily chart on TradingView hints at further upward possibilities, as technical indicators display a bullish convergence on the horizon. For instance, the Relative Strength Index (RSI), a key momentum oscillator, currently reads 60.37 and is trending upward. This suggests the BTC token could maintain its optimistic price action in the short term, though it may soon approach overbought territory around the 70 level.
Adding to this outlook, the Directional Movement Index (DMI) indicates a strengthening bullish trend, with the +DI at 26.0927 outpacing the -DI at 18.6290. This disparity signals growing bullish momentum, opening the door for Bitcoin to test and potentially breach its previous high near $68,500. A successful push above this zone could place the token within striking distance of the psychologically $70,000 mark.
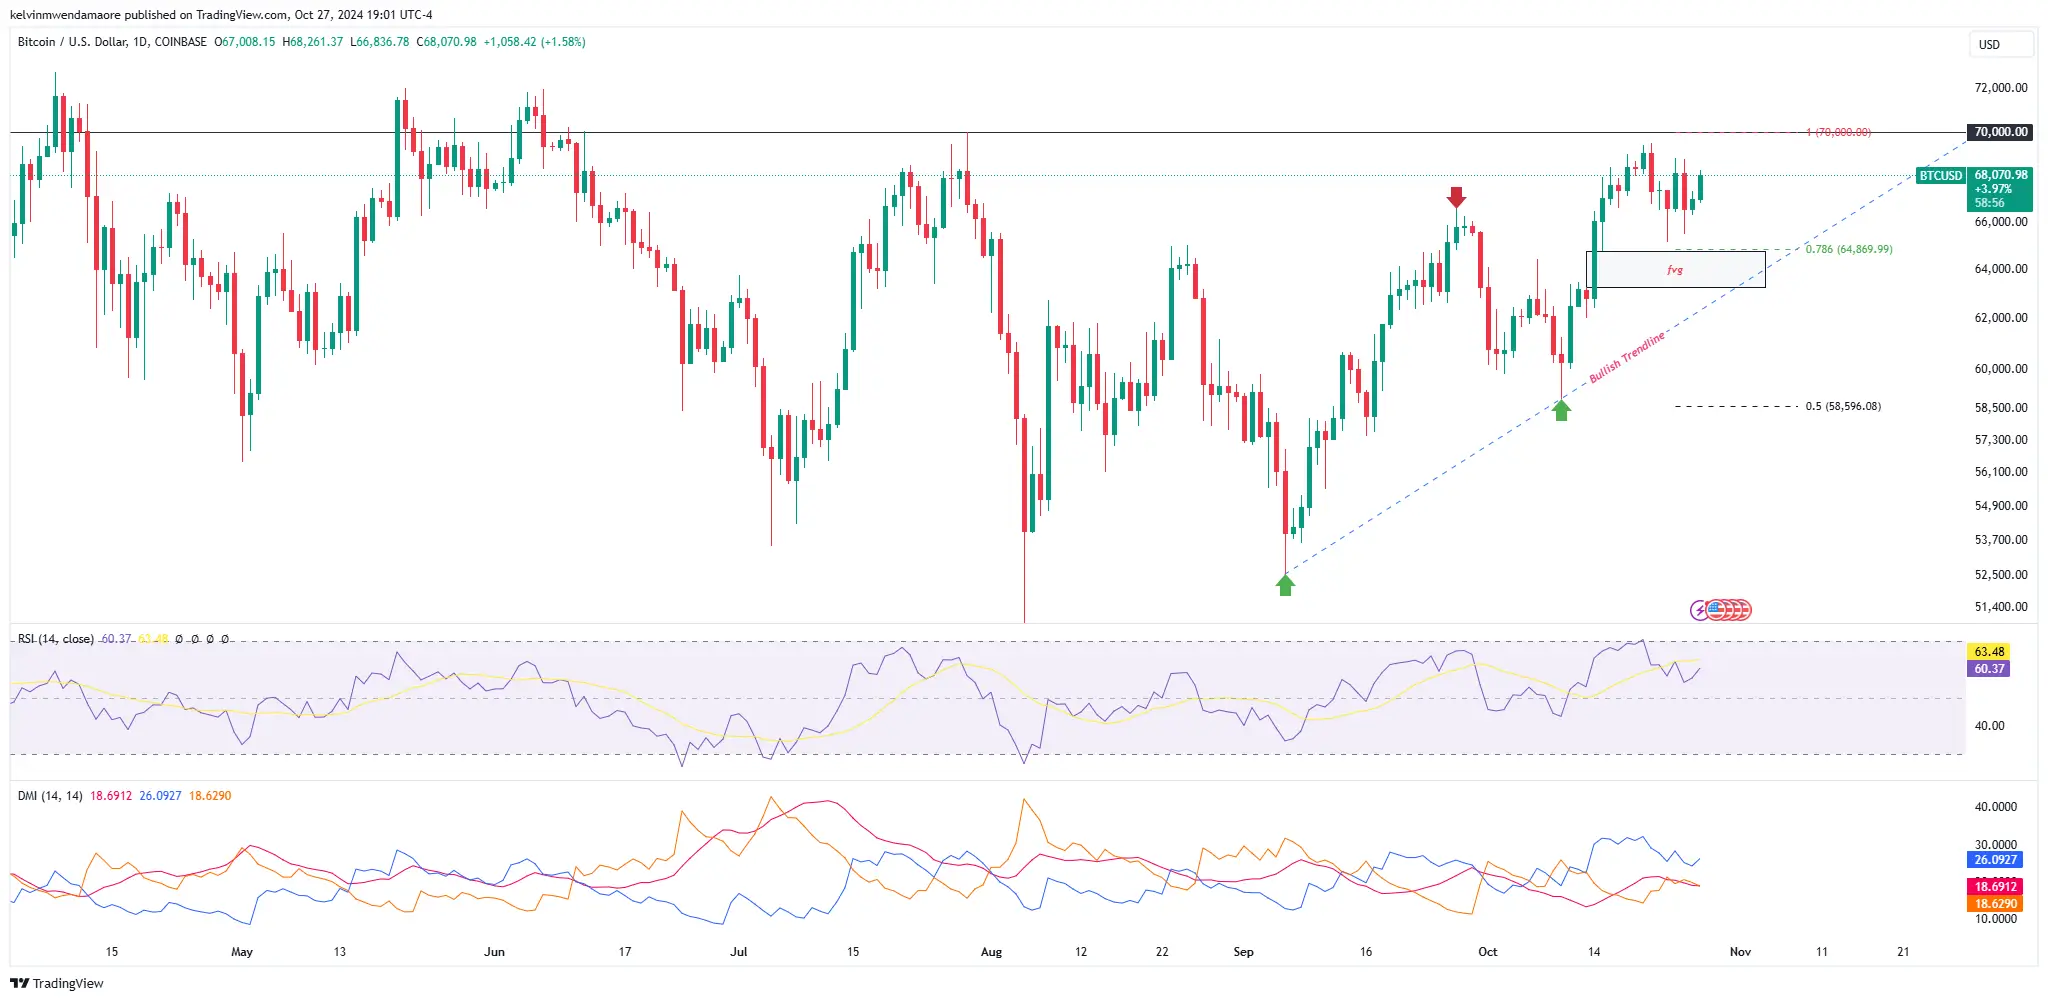

Nevertheless, traders should keep a close watch on trading volume as a key confirmation signal alongside resistance zones between $68,500 and $69,000. A clean break above $70,000 could usher in a new all-time high, solidifying Bitcoin’s bullish trend. Conversely, if the cryptocurrency dips below $67,000, a temporary pullback could be on the cards, potentially revisiting the $65,500 level or even dipping further to find support around $64.77K before resuming its upward climb.


 on Verge of Critical Downfall, Bitcoin (BTC) Eyeing $100,000, XRP: Sleeping or Skyrocketing?")


