


Binance Coin (BNB) may be on the verge of following a similar trend to Solana’s (SOL) price despite having a larger market cap than the latter. This forecast is based on the signs displayed by several technical indicators.
Currently, BNB’s coin price is $590, representing an 87% increase year-to-date. However, this value also indicates that cryptocurrency is down 18% from its all-time high. Here is why BNB could soon begin a run that takes it notably above the peak it reached in July.
Binance Coin Wants to Mirror Solana’s Movement
While BNB traded sideways, Solana’s value jumped nearly 5% within the last 24 hours. This price action makes SOL the best-performing asset out of the top 10 as it decoupled from the broader market.
According to BeInCrypto’s findings, SOL’s price movement took place during a period of broader market pessimism, suggesting that the altcoin defied crowd expectations.
Interestingly, BNB’s price seems to be facing a similar situation. According to Santiment’s data, Binance Coin’s Weighted Sentiment has dipped into negative territory, indicating that the majority of discussions surrounding the coin are currently pessimistic.
Read more: BNB Crypto Storage: Best BNB Wallets to Consider in 2024
Binance Coin Weighted Sentiment. Source: Santiment
Meanwhile, the Chaikin Money Flow (CMF) on the BNB/USD daily chart has increased. This indicator helps to monitor capital flow into a cryptocurrency and evaluates the strength of a trend.
When the CMF rises, there is a good level of accumulation, and the price can move upwards. A decline, on the other hand, indicates distribution, suggesting that the trend could be weak at this point. However, since it is the former, it means that BNB’s coin price is likely to climb higher than $600 in the coming days.

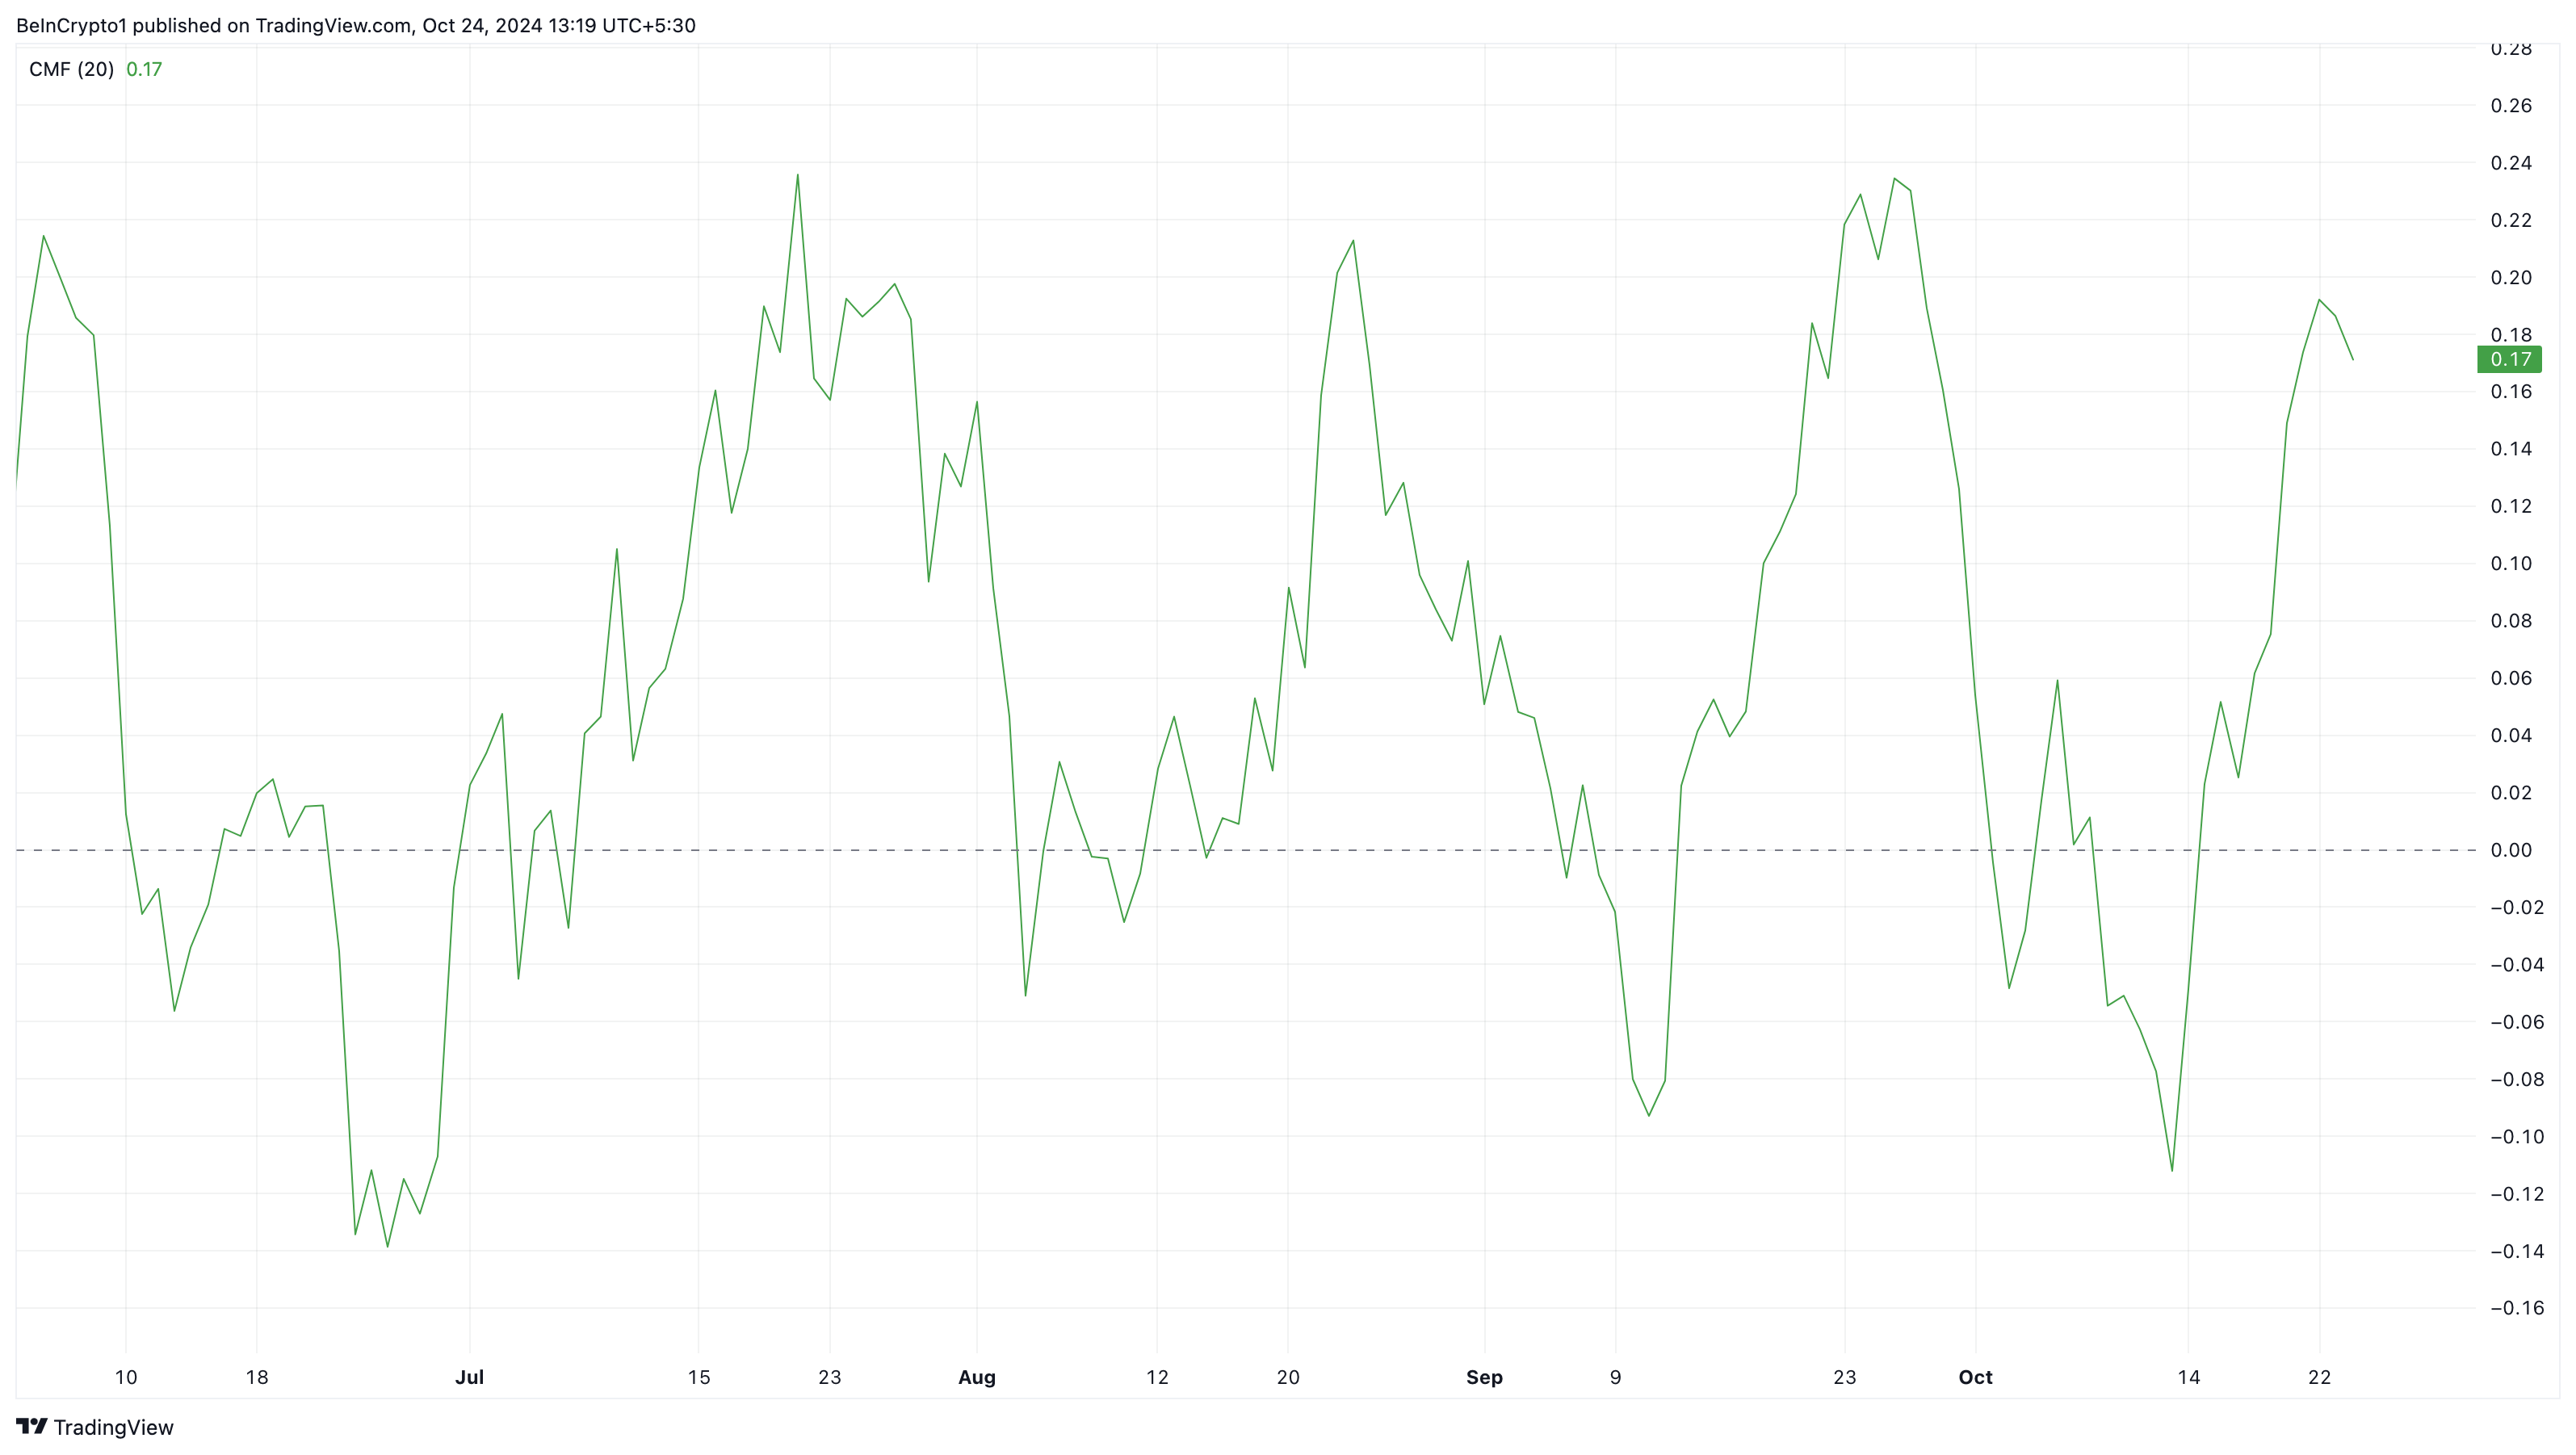
Binance Coin CMF. Source: TradingView
BNB Price Prediction: Target on $730
A further look at the BNB coin technical setup shows that the coin has formed an ascending triangle. An ascending triangle pattern is a bullish continuation pattern that forms after a prolonged uptrend.
It is characterized by price movements, with a horizontal line drawn along the swing highs and a rising trendline formed by the swing lows. This setup signals that buyers are gaining strength and typically precedes a breakout to the upside.
As seen below, BNB’s coin price has sustained this pattern, suggesting that it could be challenging for the coin to experience a correction. Notably, the cryptocurrency has to break above the 61.8% Fibonacci level, which has historically proven to be a significant resistance. Currently, that resistance is around $602.
Read more: Binance Coin (BNB) Price Prediction 2024/2025/2030
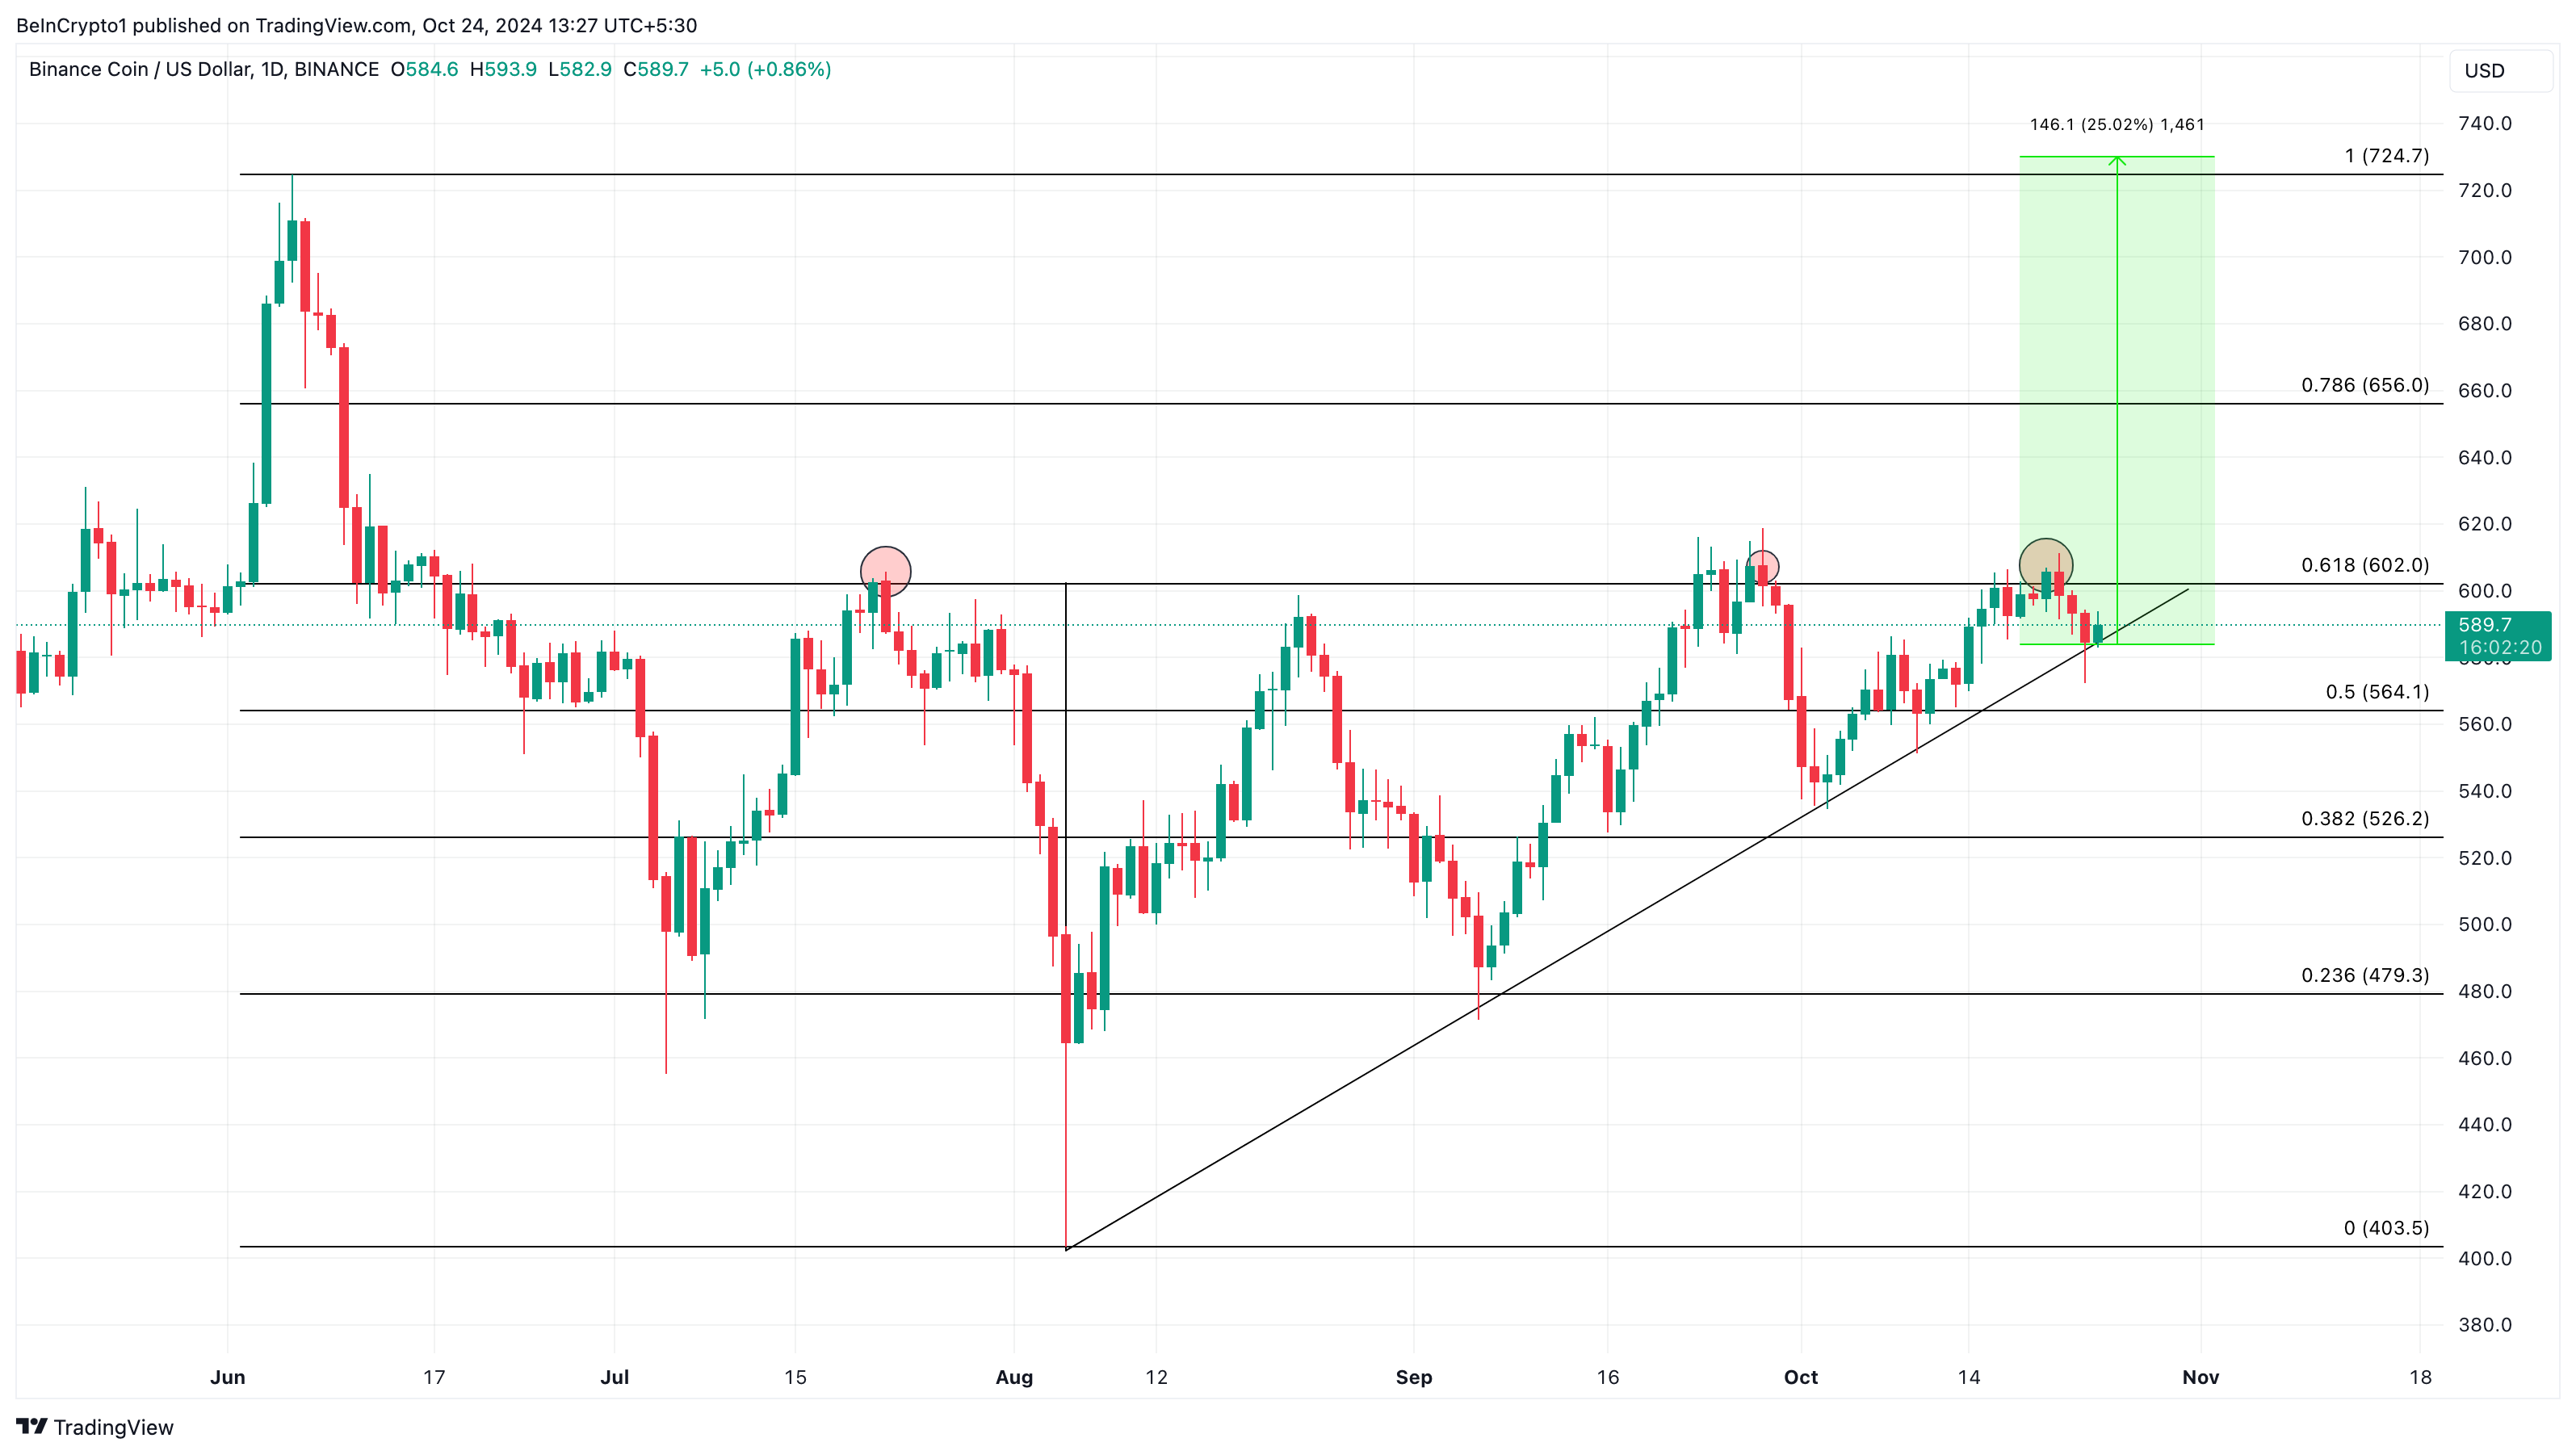
Binance Coin Daily Price Analysis. Source: TradingView
Should bulls maintain the buying pressure, then BNB’s value could rise by 25% and hit $730. On the other hand, if the coin gets rejected again at $602, this prediction might not come to pass. Instead, the price might drop to $564.


