


Bitcoin’s price movement on May 6, 2024, showcases a complex dance of volatility and potential, captured vividly across various time frames and technical indicators. With an intraday range swinging from $63,657 to $65,489, traders grapple with a trading landscape rife with both uncertainty and opportunity. As oscillators mostly suggest neutrality with glimpses of buying strength, moving averages present a more divided narrative.
Bitcoin
On the hourly chart, bitcoin (BTC) displayed a dramatic sequence of price action, soaring to a high of $65,513 before plunging sharply. The presence of strong buying momentum was abruptly disrupted by a significant sell-off, marked by a large drop in price. This volatility suggests a cautious approach, where potential traders should seek full confirmation from bullish patterns before entering.
BTC/USD daily chart.
Shifting focus to the four-hour chart, a steadier bullish trend is evident. The chart illustrates a gradual ascent over several days, culminating at around $65,513. This more stable pattern advises traders to consider entry points near the moving averages or former resistance levels now acting as support, around $64,000, ensuring they are aligned with the broader uptrend.

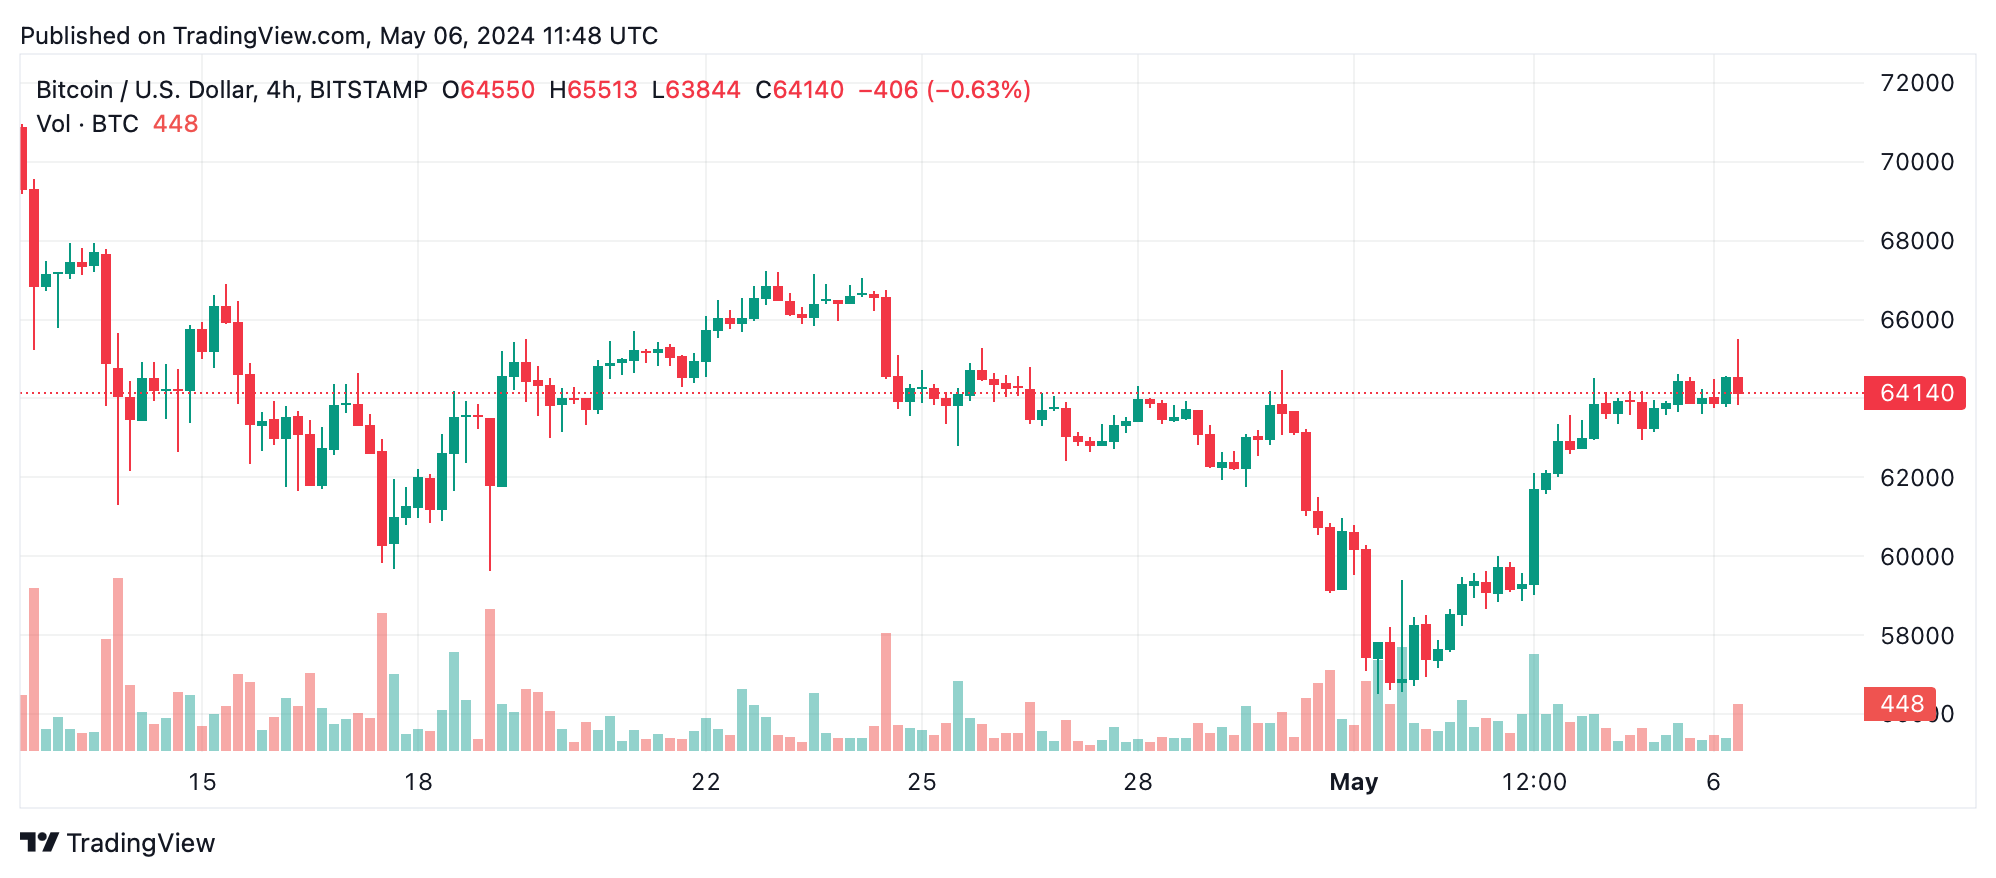
BTC/USD 4-hour chart.
The daily chart extends our perspective, showing a strong recovery from the recent low of $56,500. The ensuing bullish upswings underscore a consistent upward momentum. Traders might look to enter trades within the $62,000 to $63,000 range, leveraging prior resistance levels now serving as support, aiming to maximize gains from the prevailing upward trajectory.
Oscillators such as the relative strength index (RSI) and Stochastic remain neutral, indicating no extreme conditions in the market. However, the momentum oscillator and moving average convergence divergence (MACD) levels are signaling bullish sentiment suggesting underlying strength. These mixed signals from oscillators necessitate a balanced trading strategy, emphasizing vigilance and readiness to adapt to sudden changes.
The analysis of moving averages (MAs) reveals a divided scenario. Short-term averages like the exponential moving average (EMA) and simple moving average (SMA) for 10 and 20 days suggest a bullish stance, reflecting recent price recoveries. Conversely, longer-term averages for 30 and 50 days show a bearish signal, hinting at potential overhead resistance and a need for caution among long-term traders.
Bull Verdict:
Based on the analysis of the hourly and four-hour charts, along with the bullish signals from the shorter-term moving averages and selective oscillators, there’s a compelling case for a positive outlook on bitcoin as of May 6, 2024. The market’s ability to recover from dips and sustain upward trajectories suggests that BTC is poised to test and potentially breach the upper resistance levels near $65,500.
Bear Verdict:
Conversely, the bearish scenario is underscored by the sell signals from the longer-term moving averages and the significant sell-offs observed on the hourly chart. The mixed signals from the oscillators, coupled with the potential overhead resistance highlighted by the 30-day and 50-day averages, suggest a cautious approach. There is a tangible risk of a pullback, especially if bitcoin’s price fails to sustain the support levels.


