


- Bitcoin price finds support near its 200-day EMA around $60,000; a firm close below would suggest a decline ahead.
- BlackRock report shows Bitcoin has generally performed better than Gold in the long term during geopolitical tensions.
- Ki Young Ju, founder and CEO of CryptoQuant, explains BTC whales are unlikely to sell now.
Bitcoin (BTC) trades slightly down on Thursday, after declining over 7% this week, and holds near a crucial support level; a sustained close below this threshold could signal further declines ahead. However, BlackRock data indicates that Bitcoin outperforms Gold in the long term during geopolitical tensions, and Ki Young Ju, the founder of CryptoQuant, suggests that BTC whales are unlikely to sell now.
Bitcoin has performed better than Gold in the longer term
Bitcoin may behave like traditional risk assets in the short term. Still, a BlackRock report last month showed that BTC has shown more resilience during geopolitical tension periods than Gold in the longer term.
The table below shows that, through major geopolitical events, Bitcoin’s 10-day return and 60-day return have generally performed better than Gold and the US S&P 500 equity index.
Moreover, the recent fourth Bitcoin halving has reduced Bitcoin’s steady-state issuance rate to 0.83%, lower than Gold’s approximately 2.3%, according to a Glassnode report. This marks a historic shift in the title of the scarcest asset.
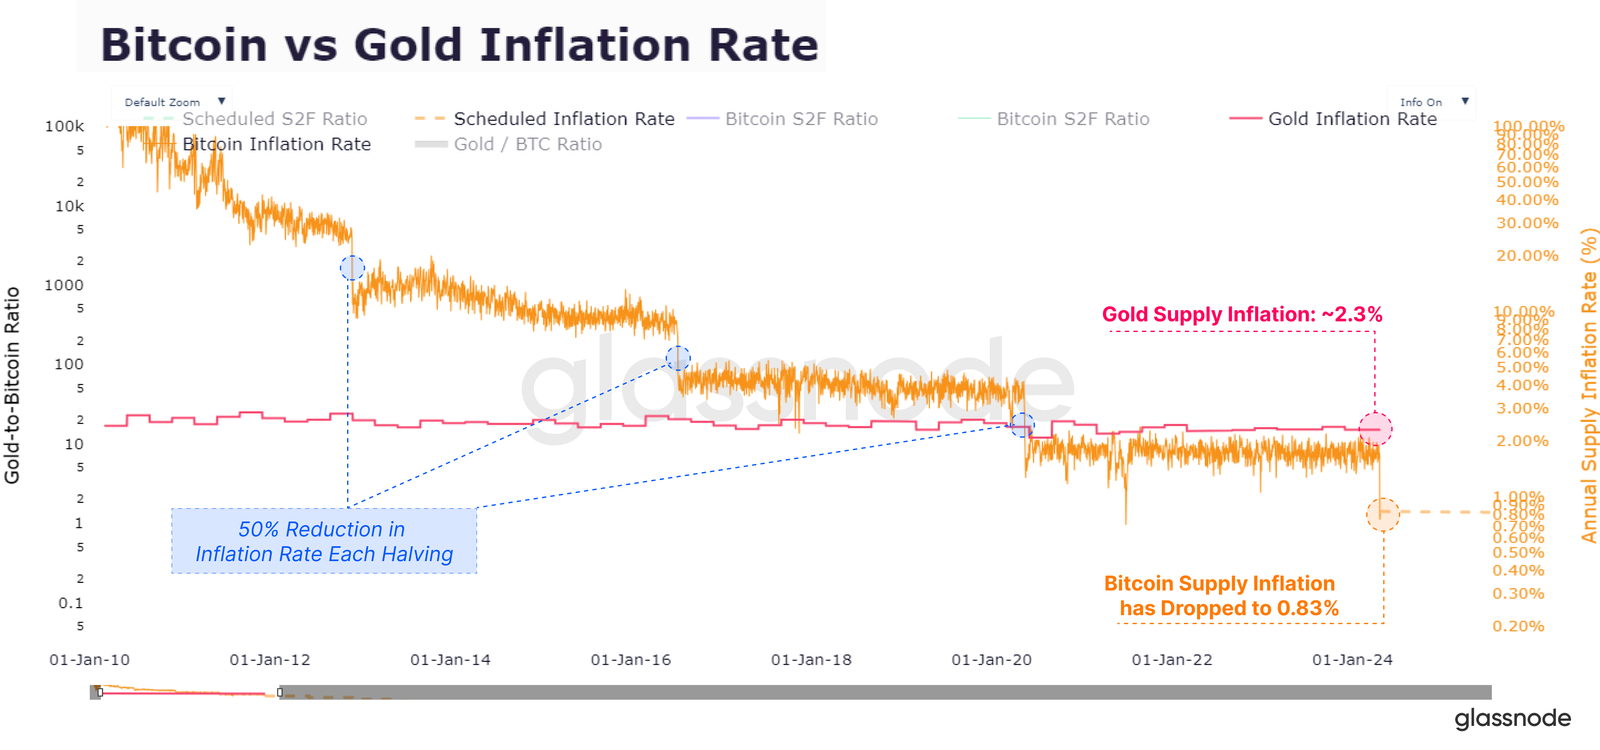

Bitcoin vs Gold Inflation Rate Chart
QCP Capital’s report on Wednesday highlights the global financial market’s reaction to the rising tensions in the Israeli-Iranian conflict. However, the risk-off move in TradFi assets was minimal. The US S&P 500 index closed 1% lower, and West Texas Intermediate (WTI) crude oil prices closed 2% higher.
However, QCP’s analysis indicates that the cryptocurrency market experienced greater volatility. Bitcoin saw a 4% drop and found support near the $60,000 mark. Further escalation could push bitcoin prices lower, potentially to $55,000, according to QCP’s projections.
“Middle East geopolitics will steal the limelight for now, but the shallow sell-off suggests that the market remains well-bid for risk assets. This minor setback shouldn’t distract from the bigger picture.” the report said.
Furthermore, the report shows that China’s policy actions and economic situation resembled Japan’s in the 1990s. To combat deflation in Japan, the Bank of Japan (BoJ) cut rates, introduced negative interest rates and started the then-novel quantitative easing program.
Similarly, the People’s Bank of China’s (PBoC) recent policies, such as rate cuts and quantitative easing programs, will likely support asset prices in China. Such bullish sentiment could potentially spill globally to support risk assets, including crypto.
Additionally, Sentiment data indicates that the recent conflicts between Iran and Israel have led crypto communities and traders to increasingly search for war-related topics, potentially fueling Fear of Missing Out (FOMO) and Fear, Uncertainty, and Doubt (FUD) among crypto market investors.


Bitcoin whales are unlikely to sell
Ki Young Ju, founder and CEO of CryptoQuant, an on-chain Data and Analytics company, posted on X that the new Bitcoin whales have accumulated aggressively and explained that these holders are neither exchange nor miner wallets and have no outflows; they are mostly custodial wallets.
Young said, “Real whales move the market through spot trading and OTC markets. That’s why on-chain data is crucial. The older whales haven’t seen particularly high returns, and the whales who entered in this recent bull run have barely made any profits.”
He further explains that the new whale wallets, primarily custodial wallets, and ETFs, have yet to generate sufficient profit, so they are unlikely to dump BTC on exchanges until liquidity from retail investors starts flowing in.
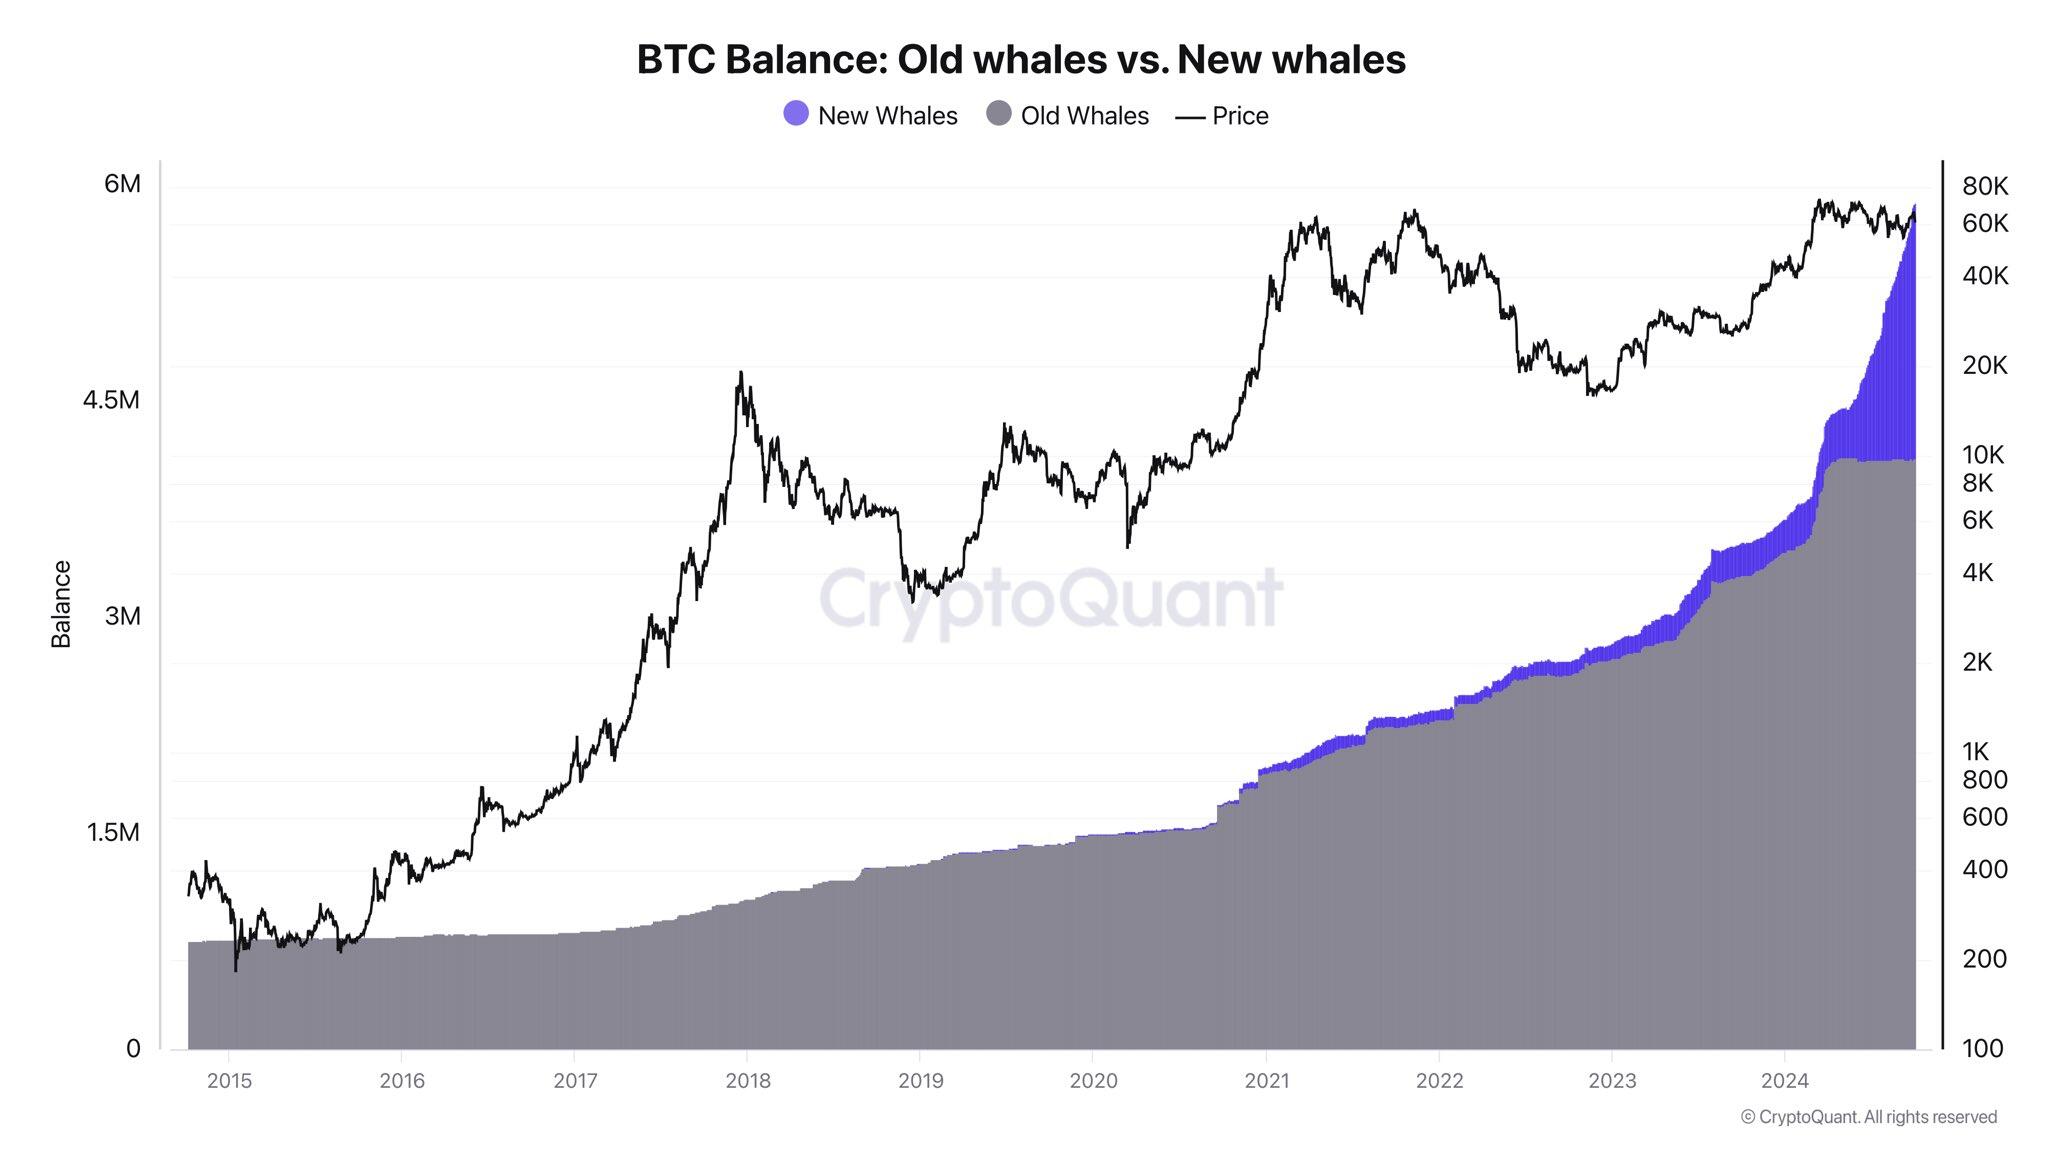

BTC Balance chart
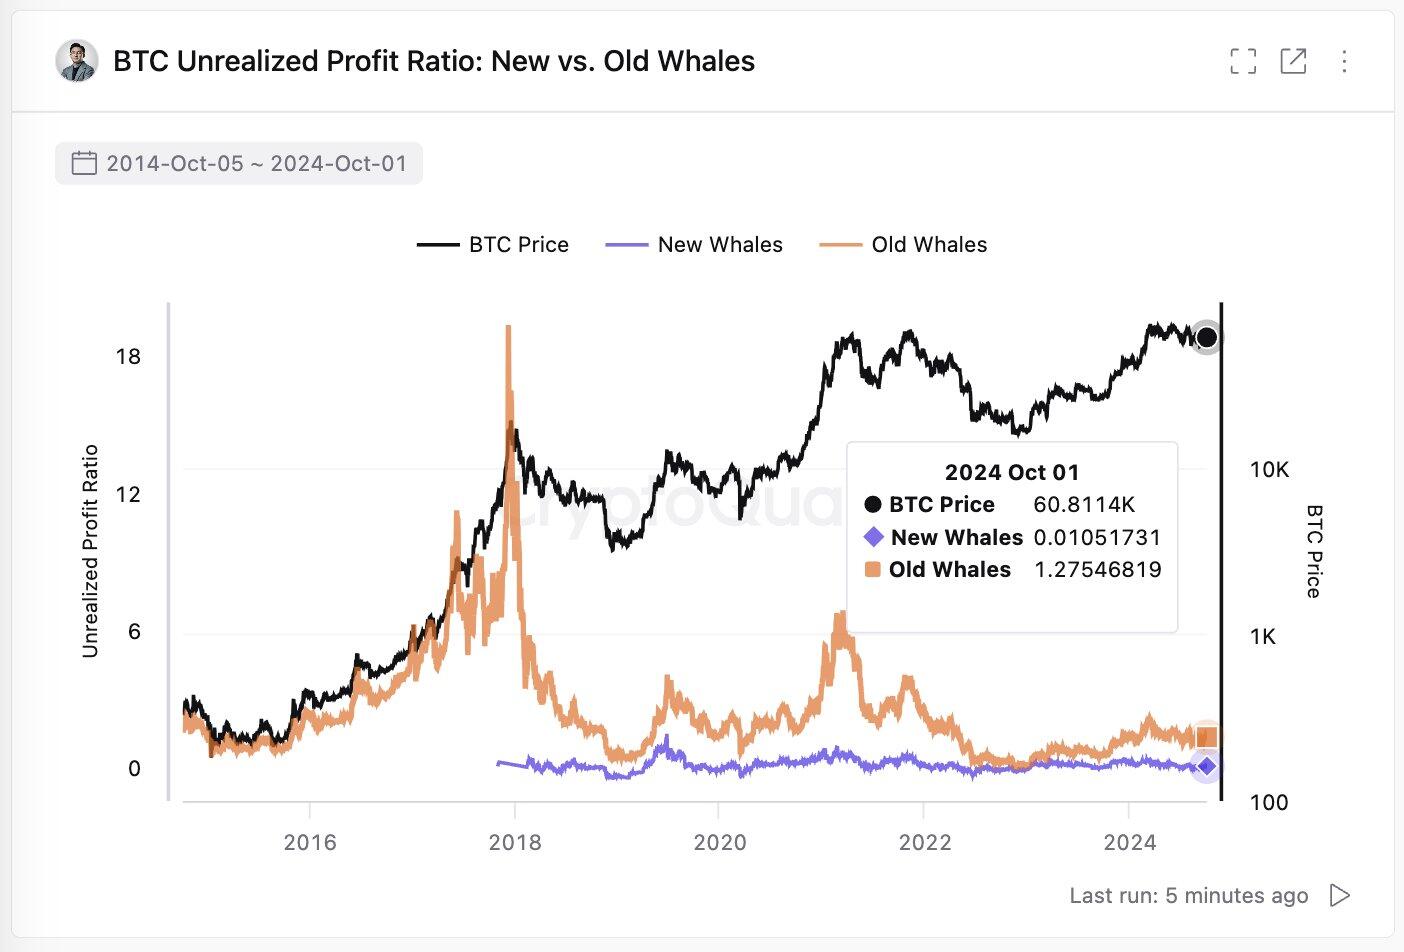

BTC New vs Old Whales unrealized profit ratio chart
BTC finds support around its 200-day EMA
Bitcoin’s price found support around its 200-day Exponential Moving Average (EMA) at $59,891 on Wednesday after declining 8.2% since Sunday. At the time of writing on Thursday, it hovers just above $60,300.
Momentum indicators like the Moving Average Convergence Divergence (MACD) signal weakness for Bitcoin, showing a bearish crossover on Tuesday. The MACD line (blue line) crossed below the signal line (yellow line), giving a sell signal. Moreover, it also shows rising red histogram bars below the neutral line zero, suggesting that Bitcoin’s price could experience downward momentum.
If BTC closes below its 200-day (EMA) at $59,891, it could decline nearly 4.6% from its current trading level to retest its September 18 low of $57,493.
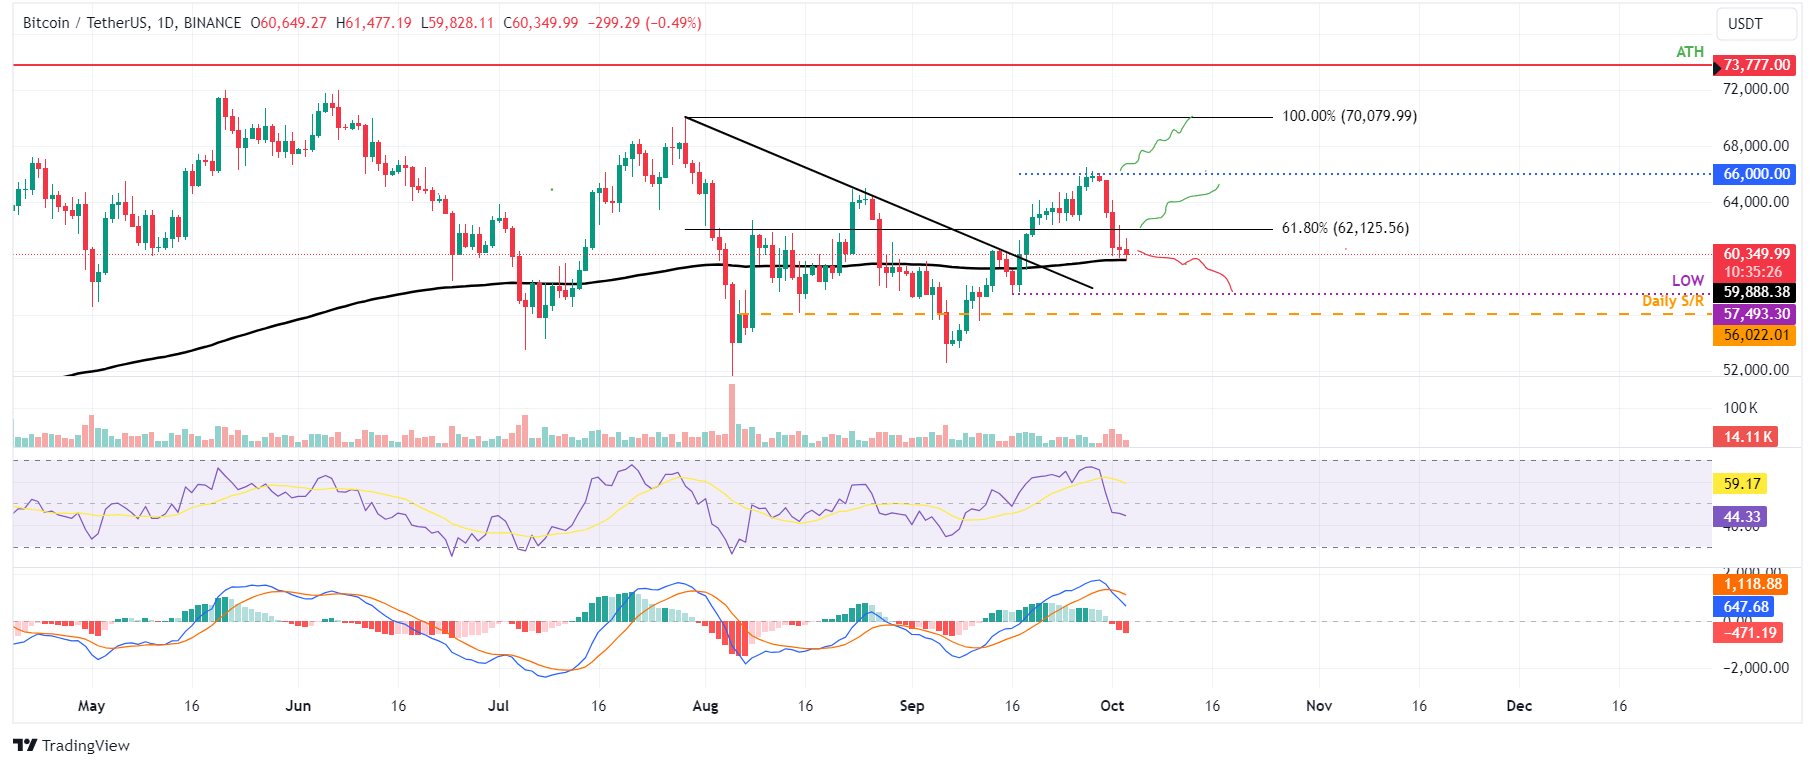

BTC/USDT daily chart
However, if BTC rises, closing above the $62,000 level, it could resume the rally to retest its next resistance at $66,000.


")


