


According to the latest technical analysis, Bitcoin (BTC) is showing promising signs of a bullish reversal.
Notably, crypto analyst Ali Martinez, in a post on X (formerly Twitter) on July 6, suggested that based on Bitcoin’s recent movements, the maiden cryptocurrency is “looking like a snack” on the three-day chart, indicating potential upward momentum.
Martinez pointed to the development of a bullish reversal doji candlestick on this timeframe, combined with a buy signal from the TD Sequential indicator. The TD Sequential is a well-regarded technical analysis tool identifying potential turning points in an asset’s price trend.
The emergence of these indicators suggests that Bitcoin may be gearing up for a significant price increase. Historically, a bullish reversal doji candlestick combined with a TD Sequential buy signal has often preceded substantial upward movements in the asset’s price.
“Bitcoin is looking like a snack in the 3-day chart. It is developing a bullish reversal doji candlestick, combined with a buy signal by the TD Sequential,” he said.
Path to $60,000
In this case, if the bullish reversal materializes, Bitcoin’s next major target will be around the $60,000 mark. Initially, the analyst had noted that for Bitcoin to embark on a bullish move, the crypto must reclaim the $61,000 mark and hold the position.
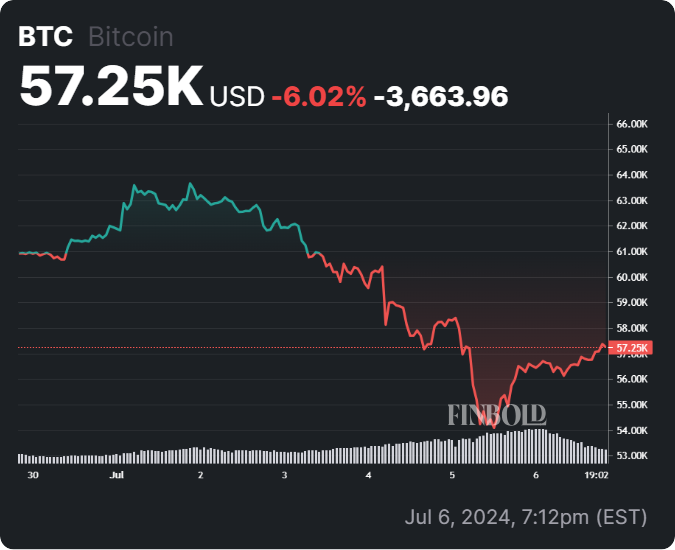
With Bitcoin currently hovering above $57,000, a move towards $60,000 seems plausible if the bullish indicators hold firm.
Overall, although Bitcoin shows signs of a bullish reversal, the overall market sentiment remains bearish. However, the long-standing consensus is that the maiden crypto will likely rally.
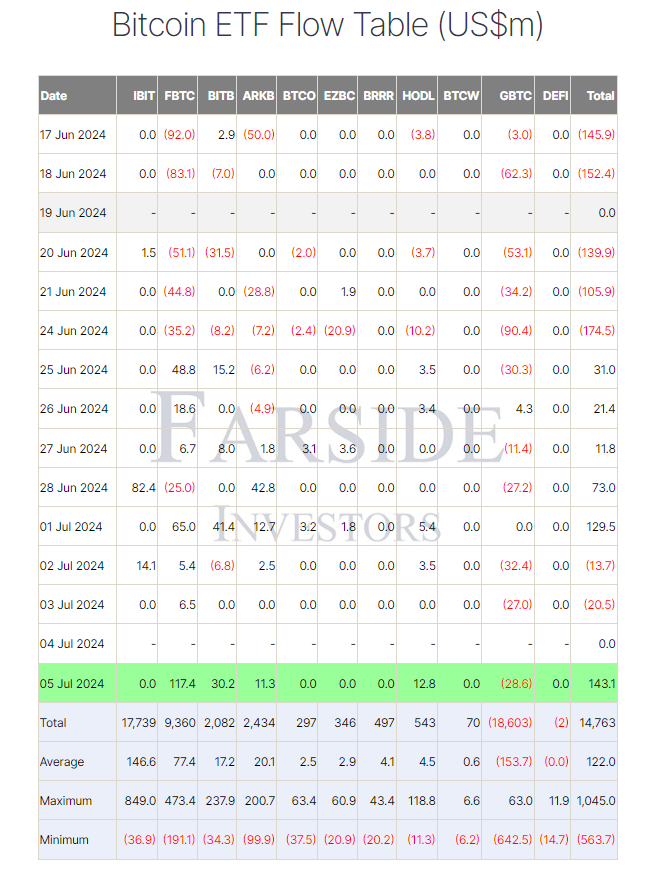
This aspect is evidenced by the fact that United States-based spot Bitcoin exchange-traded funds (ETFs) experienced a surge in inflows on July 6. The significant inflows emerged after Bitcoin plunged to below $54,000 on July 4, indicating investors are buying the dip.
Data shared by Farside Investors indicated that spot Bitcoin ETFs recorded their most significant net inflows in a month at $143.1 million.

In the meantime, the market will seek to shake off any panic emanating from the Mt. Gox creditors’ repayments, which have been attributed to the ongoing bearish sentiments.
Bitcoin price analysis
By press time, Bitcoin was trading at $57,250, reflecting gains of over 1% in the last 24 hours. In the weekly timeframe, BTC is down by over 6%.

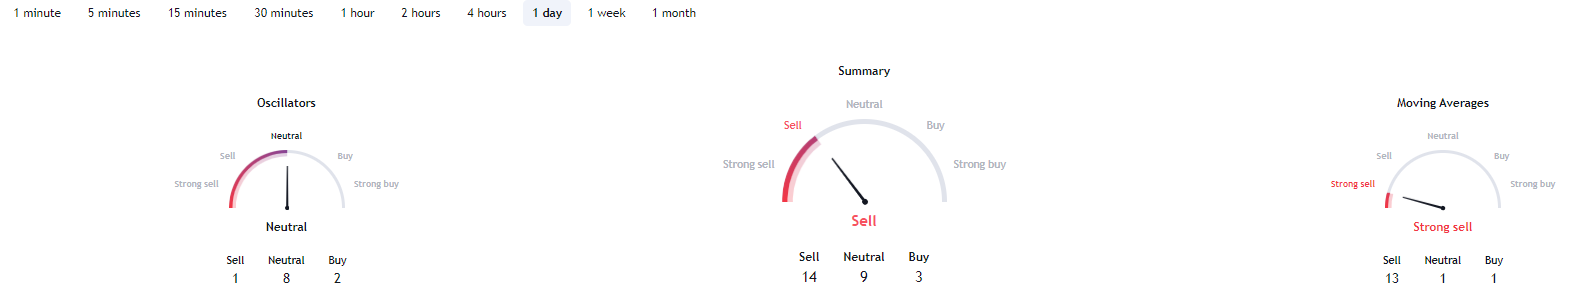
Elsewhere, according to data retrieved from TradingView, Bitcoin technical analysis is mainly dominated by sell sentiments. The oscillators are primarily neutral, with eight indicators in this category, one indicating a sell and two suggesting a buy.
The summary shows a strong sell signal, with 14 indicators suggesting sell, nine neutral, and only three indicating buy. The moving averages reinforce this bearish sentiment, showing a strong sell signal with thirteen indicators suggesting sell, one neutral, and one indicating buy.

Overall, with Bitcoin turning green in the short term, the next target is to retain the price above the $57,000 support for any chance of reclaiming $60,000 to be realized.
Disclaimer: The content on this site should not be considered investment advice. Investing is speculative. When investing, your capital is at risk.


 Price Eyes $106K, Saylor Blames Short-Term Holders for Delay to $150K")


 Price Targets $4,000 After Breaking Key Resistance Levels")


