


Bitcoin slides under $75K amid rising global market fears, with whales shorting and key support levels in danger. Is a move to $70K next?
As a ripple effect of a crash in global markets, fear in the crypto market is reaching an extreme state. The total crypto market cap has dropped to $2.34 trillion, witnessing an 11% decline over the last seven days.
Amid the increasing fear, Bitcoin is down to $74,636, trading at a market price last seen on November 9. As the market declines, is a breakdown towards $70,000 possible?
Bitcoin Falls Under $75K, EMAs Near Death Cross
In the daily chart, Bitcoin’s price trend shows another failure to overcome the local resistance trendline. This has resulted in a 6.19% drop in Bitcoin’s price on Sunday, marking the lowest closing price of $78,342 since early November.
Bitcoin Price Chart
Extending the bearish correction, Bitcoin has registered an intraday drop of 2.9%, trading near the $74,000 mark. This sudden turnaround follows Donald Trump’s decision to impose significant reciprocal tariffs on multiple countries globally.
The 50% Fibonacci level at $75,538 coincides with the demand zone, extending from $75,600 to $75,462. This marks a crucial support zone for Bitcoin. As Bitcoin’s falling price signals a critical support level breakdown, downside potential continues to grow.
Notably, technical indicators are flashing sell signals amid the increasing bearish pressure. The MACD and signal lines show a negative crossover and a resurgence of bearish histograms.
Additionally, the 50- and 200-day EMA lines show a downturn, suggesting a possible death cross on the daily chart.
Bearish Sentiment Drives Up Short Positions by Whales
Amid the possibility of a steeper correction, DarkFost, a crypto on-chain analyst, highlights the increasing bearish sentiment among crypto whales. According to the analyst, whales are more inclined to set short Bitcoin positions than retail investors.
The Whale vs. Retail Ratio is close to 0.15, a relatively low value that indicates growing bearish sentiment among crypto whales.
➡️ According to the whale vs retail ratio built on @Alphractal, we’re seeing that whales are more inclined to set short positions on BTC than retail investors.
The ratio currently stands around 0.15, which is relatively low and aligns with the bearish sentiment among whales.
➡️… pic.twitter.com/kTJGUkzr8Z— Darkfost (@Darkfost_Coc) April 6, 2025
Furthermore, as the market turns bearish, the Liquidation Map warns of a major long liquidation move. Based on the HyperLiquid liquidation map, a drop to $73,187 would result in the liquidation of 609.53 BTC. Out of the total cumulative long liquidation leverage, long positions account for 550.58 BTC.
Meanwhile, Bitcoin’s open interest stands at $52.30 billion, witnessing a minor drop of 2.32%. However, the volume has increased by nearly 138%, reaching $149.95 billion.
Furthermore, the Bitcoin Long/Short Ratio chart shows an increasing number of short positions over the past four hours. Short positions account for 52.62%, dropping the Long to Short Ratio to 0.9004.

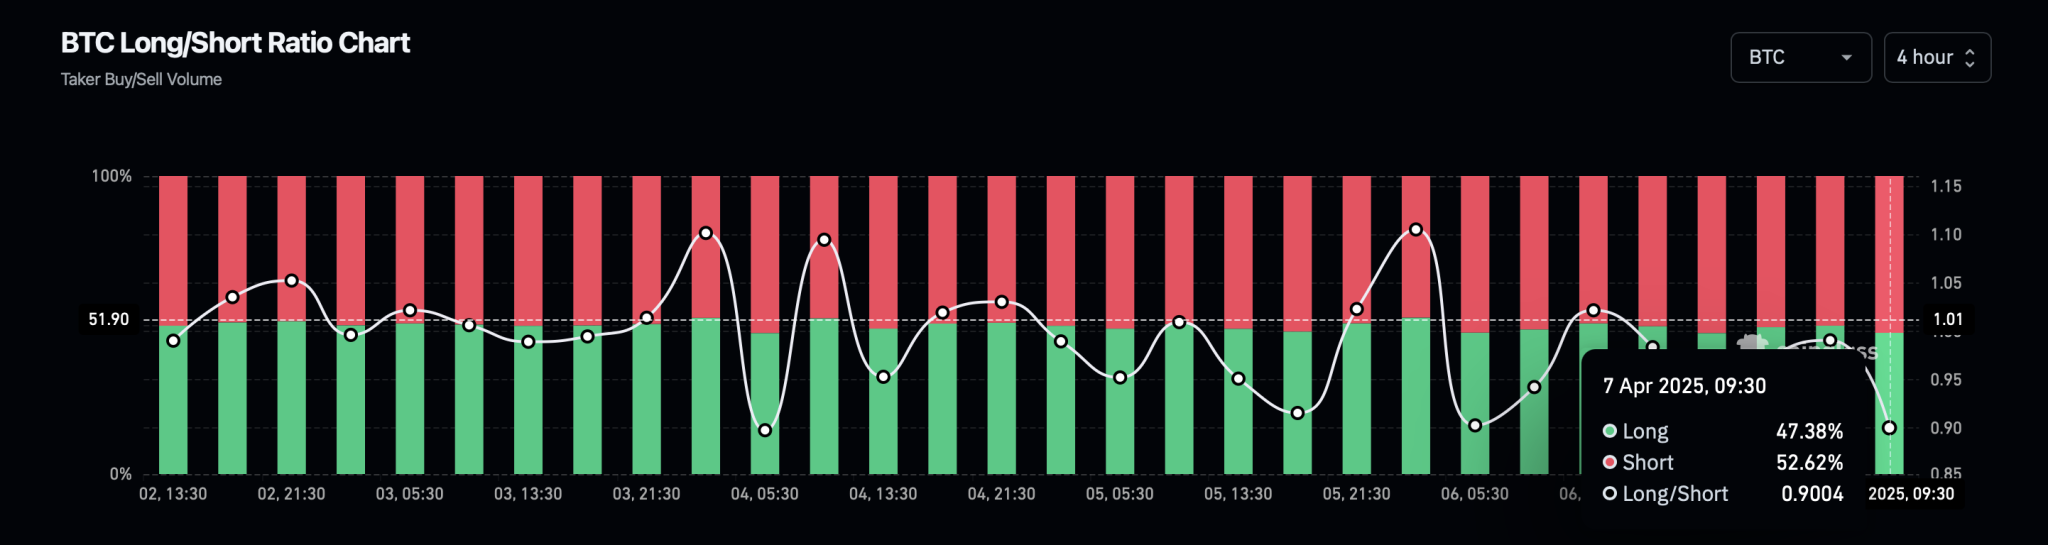
Bitcoin LongShort Ratio Chart
Will Bitcoin Drop $70K?
As Bitcoin breaks below the $75,000 mark, a decline below the 50% Fibonacci level is likely. This would place the immediate price target at $69,699, corresponding to the 38.20% Fibonacci level.
On the other hand, a price rejection and a short-term relief rally could help Bitcoin avoid closing below the 50% Fibonacci level. This would increase the possibility of a new upswing to challenge the overhead resistance trendline if global markets witness a bounce back.
However, the week will likely witness increased volatility due to several major events, including the release of Industrial Sector Index data, JOLTs Job Openings data, Service Sector Index data, Non-Farm Payrolls, and the Employment Rate.


 on Verge of Critical Downfall, Bitcoin (BTC) Eyeing $100,000, XRP: Sleeping or Skyrocketing?")


