


Over the past 60 minutes, bitcoin’s price has oscillated narrowly between $94,853 and $95,202, reflecting subdued trading activity amid a $1.88 trillion market valuation and $31 billion in daily volume. The asset has fluctuated between $94,898 and $98,467 in the last 24 hours, lingering 12.6% beneath its historic peak recorded 22 days prior.
Bitcoin
The one hour BTC/USD chart reveals erratic trading patterns marked by successive lower peaks and troughs, hinting at a bearish trajectory. Buyers have faltered in sustaining upward momentum, ceding ground to sellers in recent sessions. A breach below $94,500 may invite a descent toward the $92,000 support tier, while the $98,500-$100,000 ceiling persists as a formidable hurdle for meaningful recovery. Absent a decisive climb above this zone, pessimism governs the broader trend.
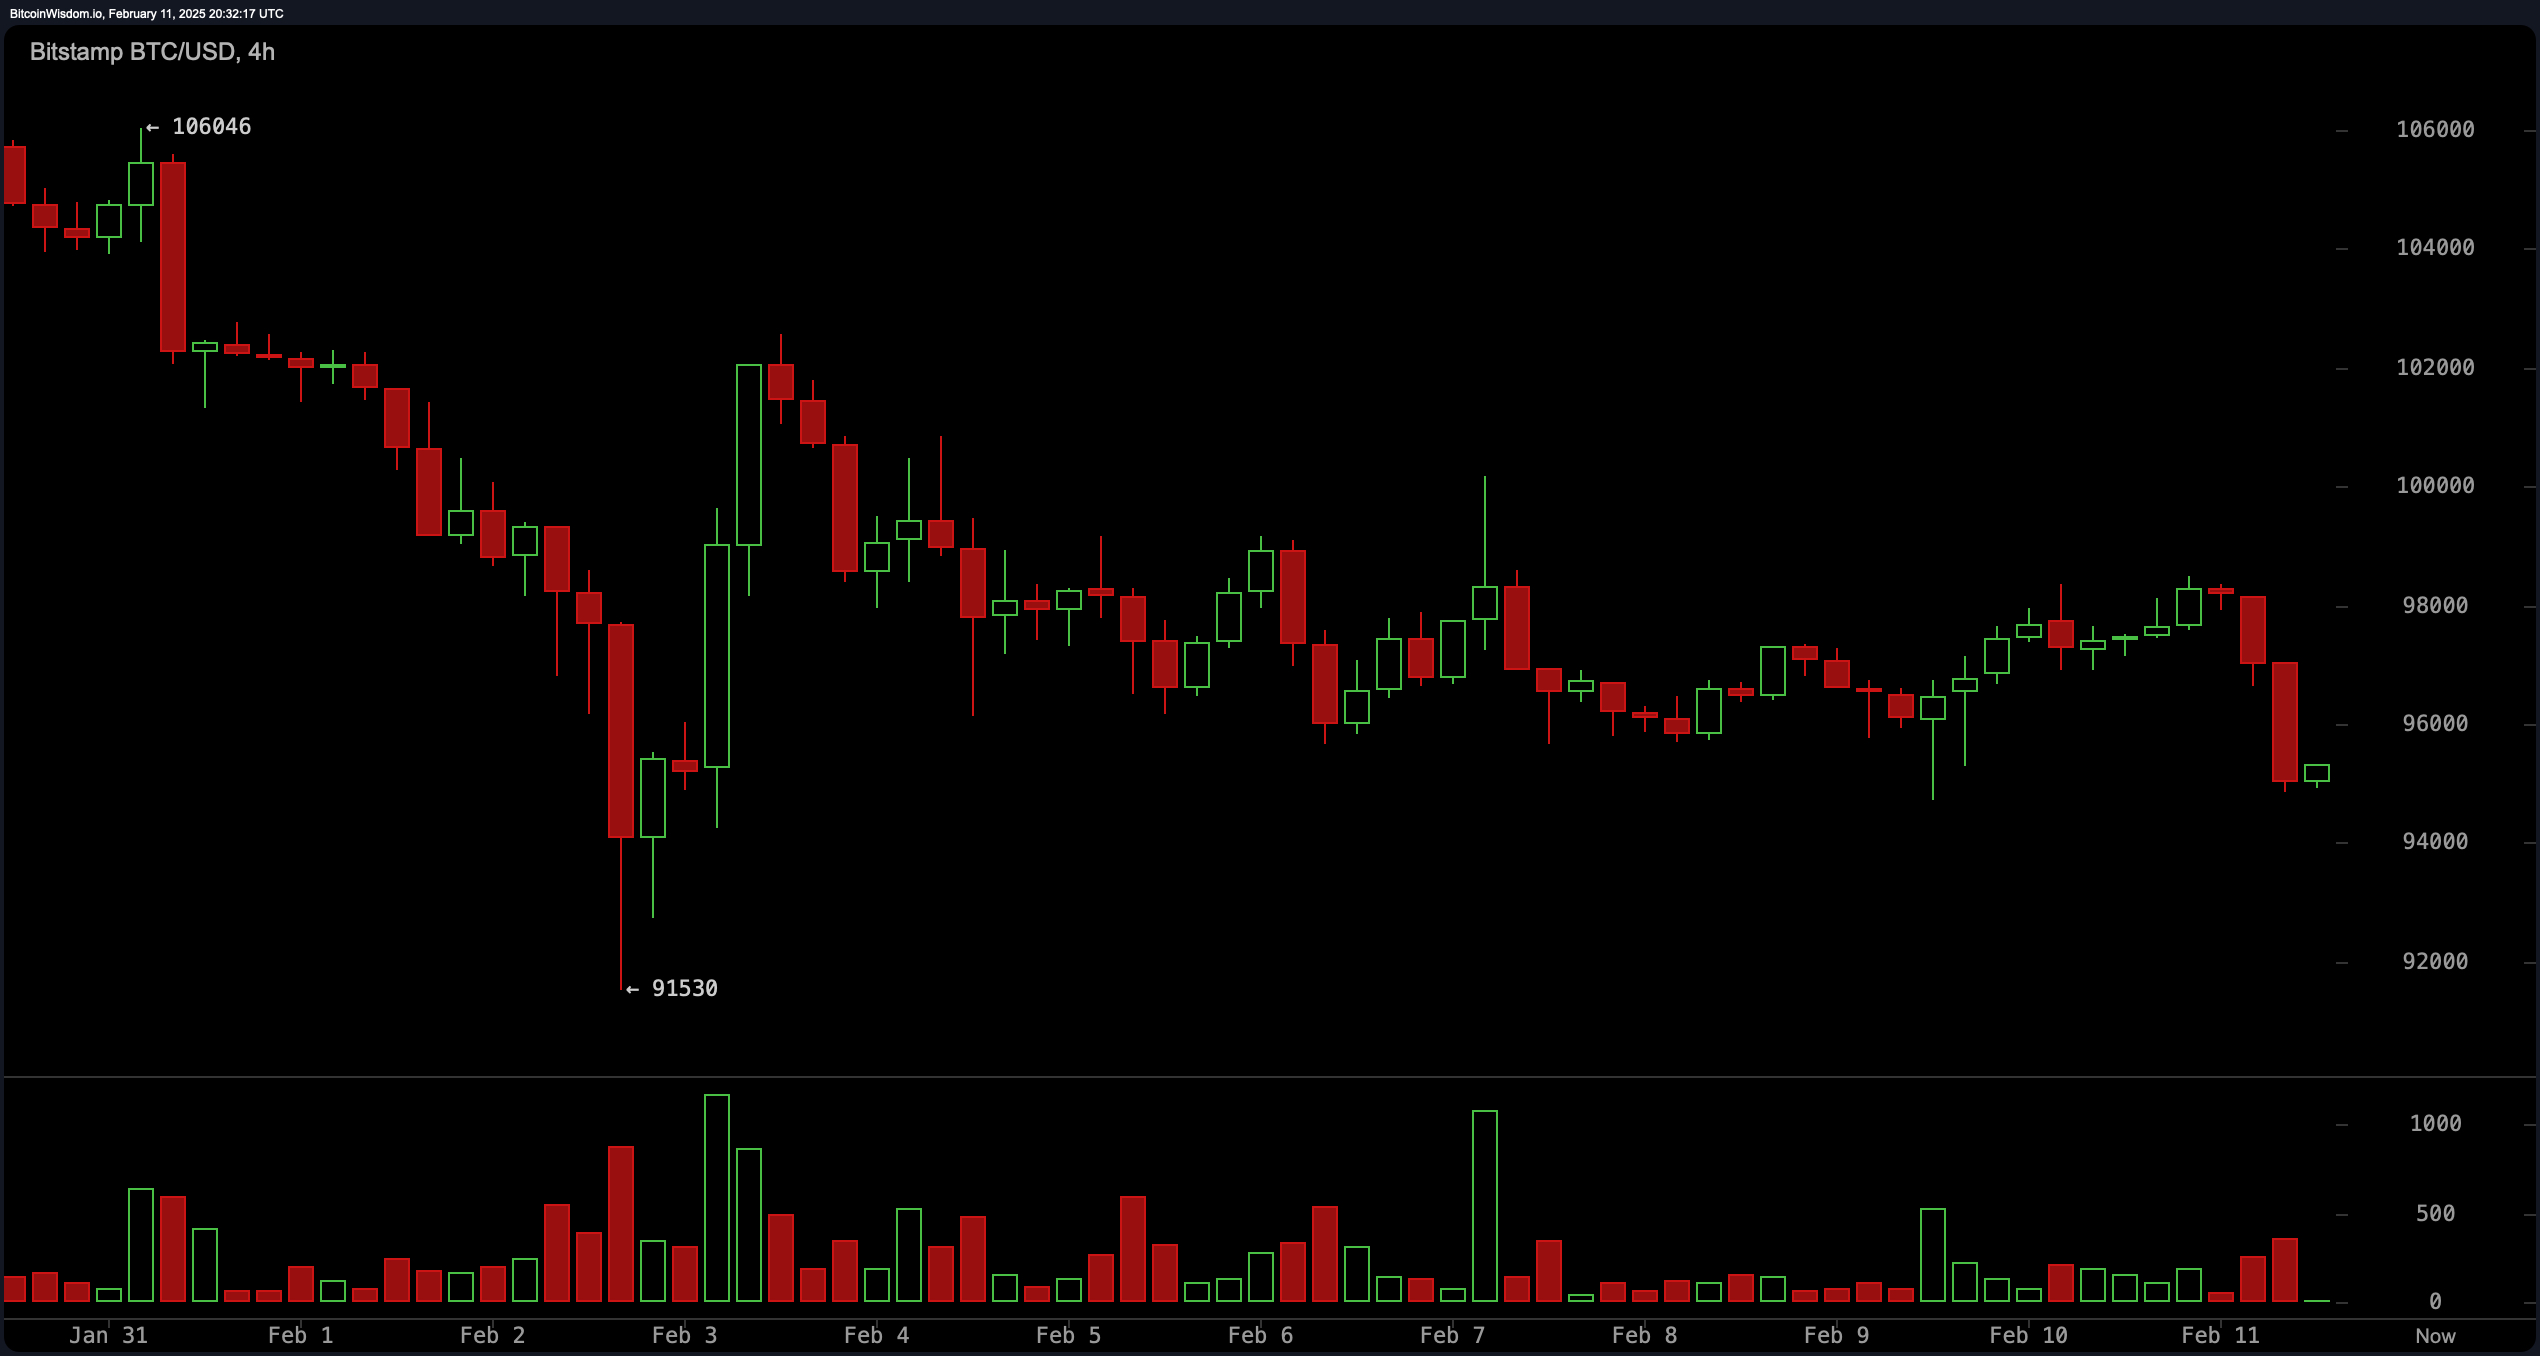
The four-hour timeframe reinforces a corrective phase, with downward pressure stifling rebound attempts. Frail price movements—evidenced by repeated rejections at interim resistance—signal fragility. Should Bitcoin falter in carving higher troughs, a steeper retreat becomes plausible. Vigilance around $94,500 is critical; a breakdown here might propel prices toward the $91,500-$92,000 corridor, where demand could reawaken.

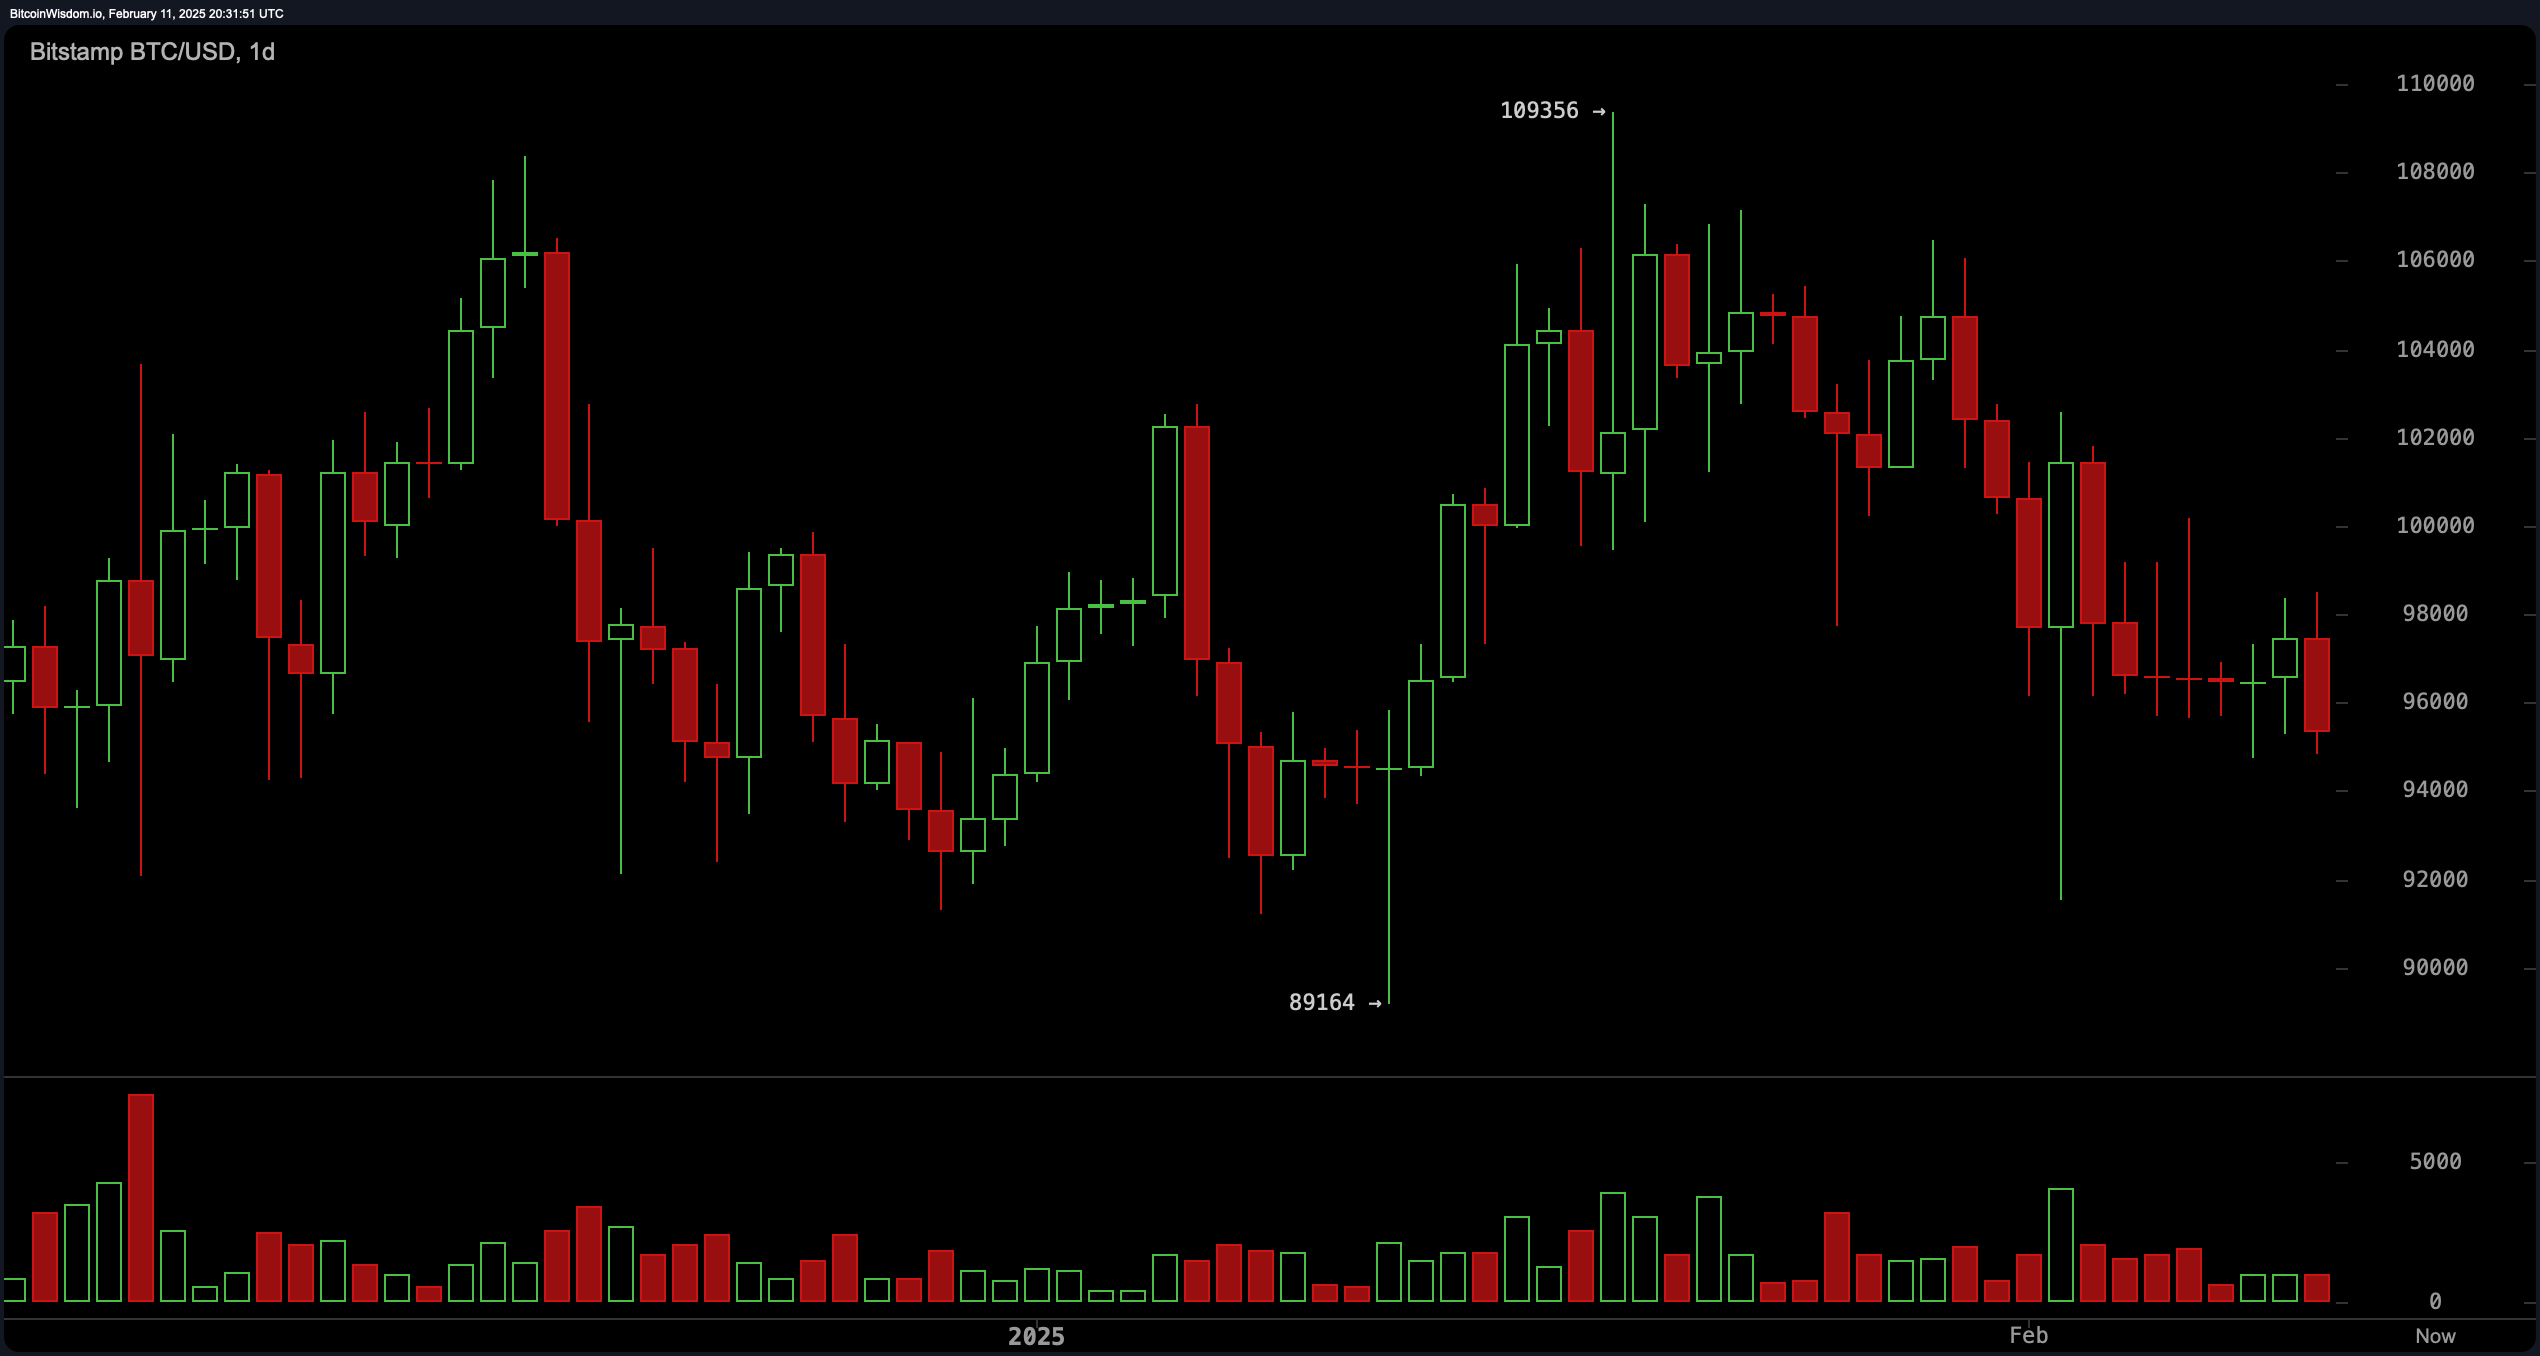
As for the daily, a sharp sell-off dominates this lens, punctuated by thick bearish candles and amplified volume, crystallizing short-term negativity. Sellers have stifled rallies, leaving upward attempts listless. While consolidation near current levels might offer fleeting stability, the absence of bullish conviction keeps the door ajar for further declines. A forceful leap above $98,500 could invigorate buyers, though rejection here risks reigniting liquidation momentum.
Oscillators paint divergent signals: The relative strength index (RSI) at 40 reflects equilibrium, while the Stochastic (32), commodity channel index (-93), and average directional index (26) suggest ambivalent stances. Conversely, the momentum indicator (-5,489) and moving average convergence divergence (MACD) (-1,113) flash caution, tilting risk toward additional losses.
Shorter-term moving averages amplify the somber outlook. Exponential moving averages (EMA) for 10, 20, and 30 periods hover at $97,494, $98,723, and $99,002, respectively, with analogous simple moving averages (SMA) tracing descending trajectories. The EMA 50 ($98,259) and SMA 50 ($98,711) compound the gravitational tug, while the EMA 100 ($93,414) and EMA 200 ($84,141) loom as potential safety nets. Failure to reclaim the 100-period SMAs ($96,085; $79,254) may cement the bearish near-term narrative.
Bull Verdict:
Despite recent selling pressure, bitcoin remains within a broader consolidation range, and a decisive break above $98,500 could shift momentum in favor of buyers. If volume increases and bitcoin reclaims key moving averages, a rally toward $100,000 and beyond remains possible. Long-term support from the 100-period and 200-period exponential moving averages suggests that bulls still have a foothold, making a reversal feasible if buying pressure emerges at key levels.
Bear Verdict:
Bitcoin’s inability to hold above critical support levels, combined with bearish moving averages and weak momentum indicators, signals continued downside risk. With multiple rejection points near $98,500 and increasing selling pressure on shorter timeframes, the probability of a drop toward $92,000 or lower remains high. If volume remains low and bitcoin fails to reclaim lost ground, the market may see further declines before any significant recovery attempt.


