


On Feb. 2, 2025, XRP oscillated at $2.57 to $2.61 over the last hour, its market valuation eclipsing $150 billion alongside a $12.19 billion daily turnover. Intraday fluctuations spanned $2.52 to $2.95 per XRP, mirroring intense volatility as supply overwhelmed demand.
XRP
XRP’s hourly chart reveals a dominant bearish trajectory, with prices faltering in attempts to maintain upward progress. Supply-side forces have dictated movement, illustrated by sequential declines in peaks and troughs. Resistance solidifies at $2.75, while $2.50 anchors tentative support. A failure to breach resistance may catalyze a descent toward the Fibonacci extension at $2.40. The relative strength index (RSI) lingers near equilibrium, hinting at possible deterioration if sell-offs persist. Meanwhile, the moving average convergence divergence (MACD) remains entrenched in negative alignment, amplifying XRP’s pessimistic forecasts.
XRP/USD 1H chart via Bitfinex on Feb. 2, 2025.
Expanding to the four-hour timeframe, XRP has persistently underperformed critical exponential moving averages (EMA) and simple moving averages (SMA), validating sustained downward momentum. A forceful rejection at $2.75 underscores buyers’ lack of conviction, with prices gravitating toward deeper corrections. The $2.50 support zone now acts as a linchpin; a violation of this threshold could hasten a retreat to $2.40. Resistance crystallizes at the 38.2% Fibonacci retracement ($3.05), necessitating a decisive close above this barrier to suggest recovery. Until then, bearish strategies hold appeal, with traders monitoring resistance zones for tactical entries.

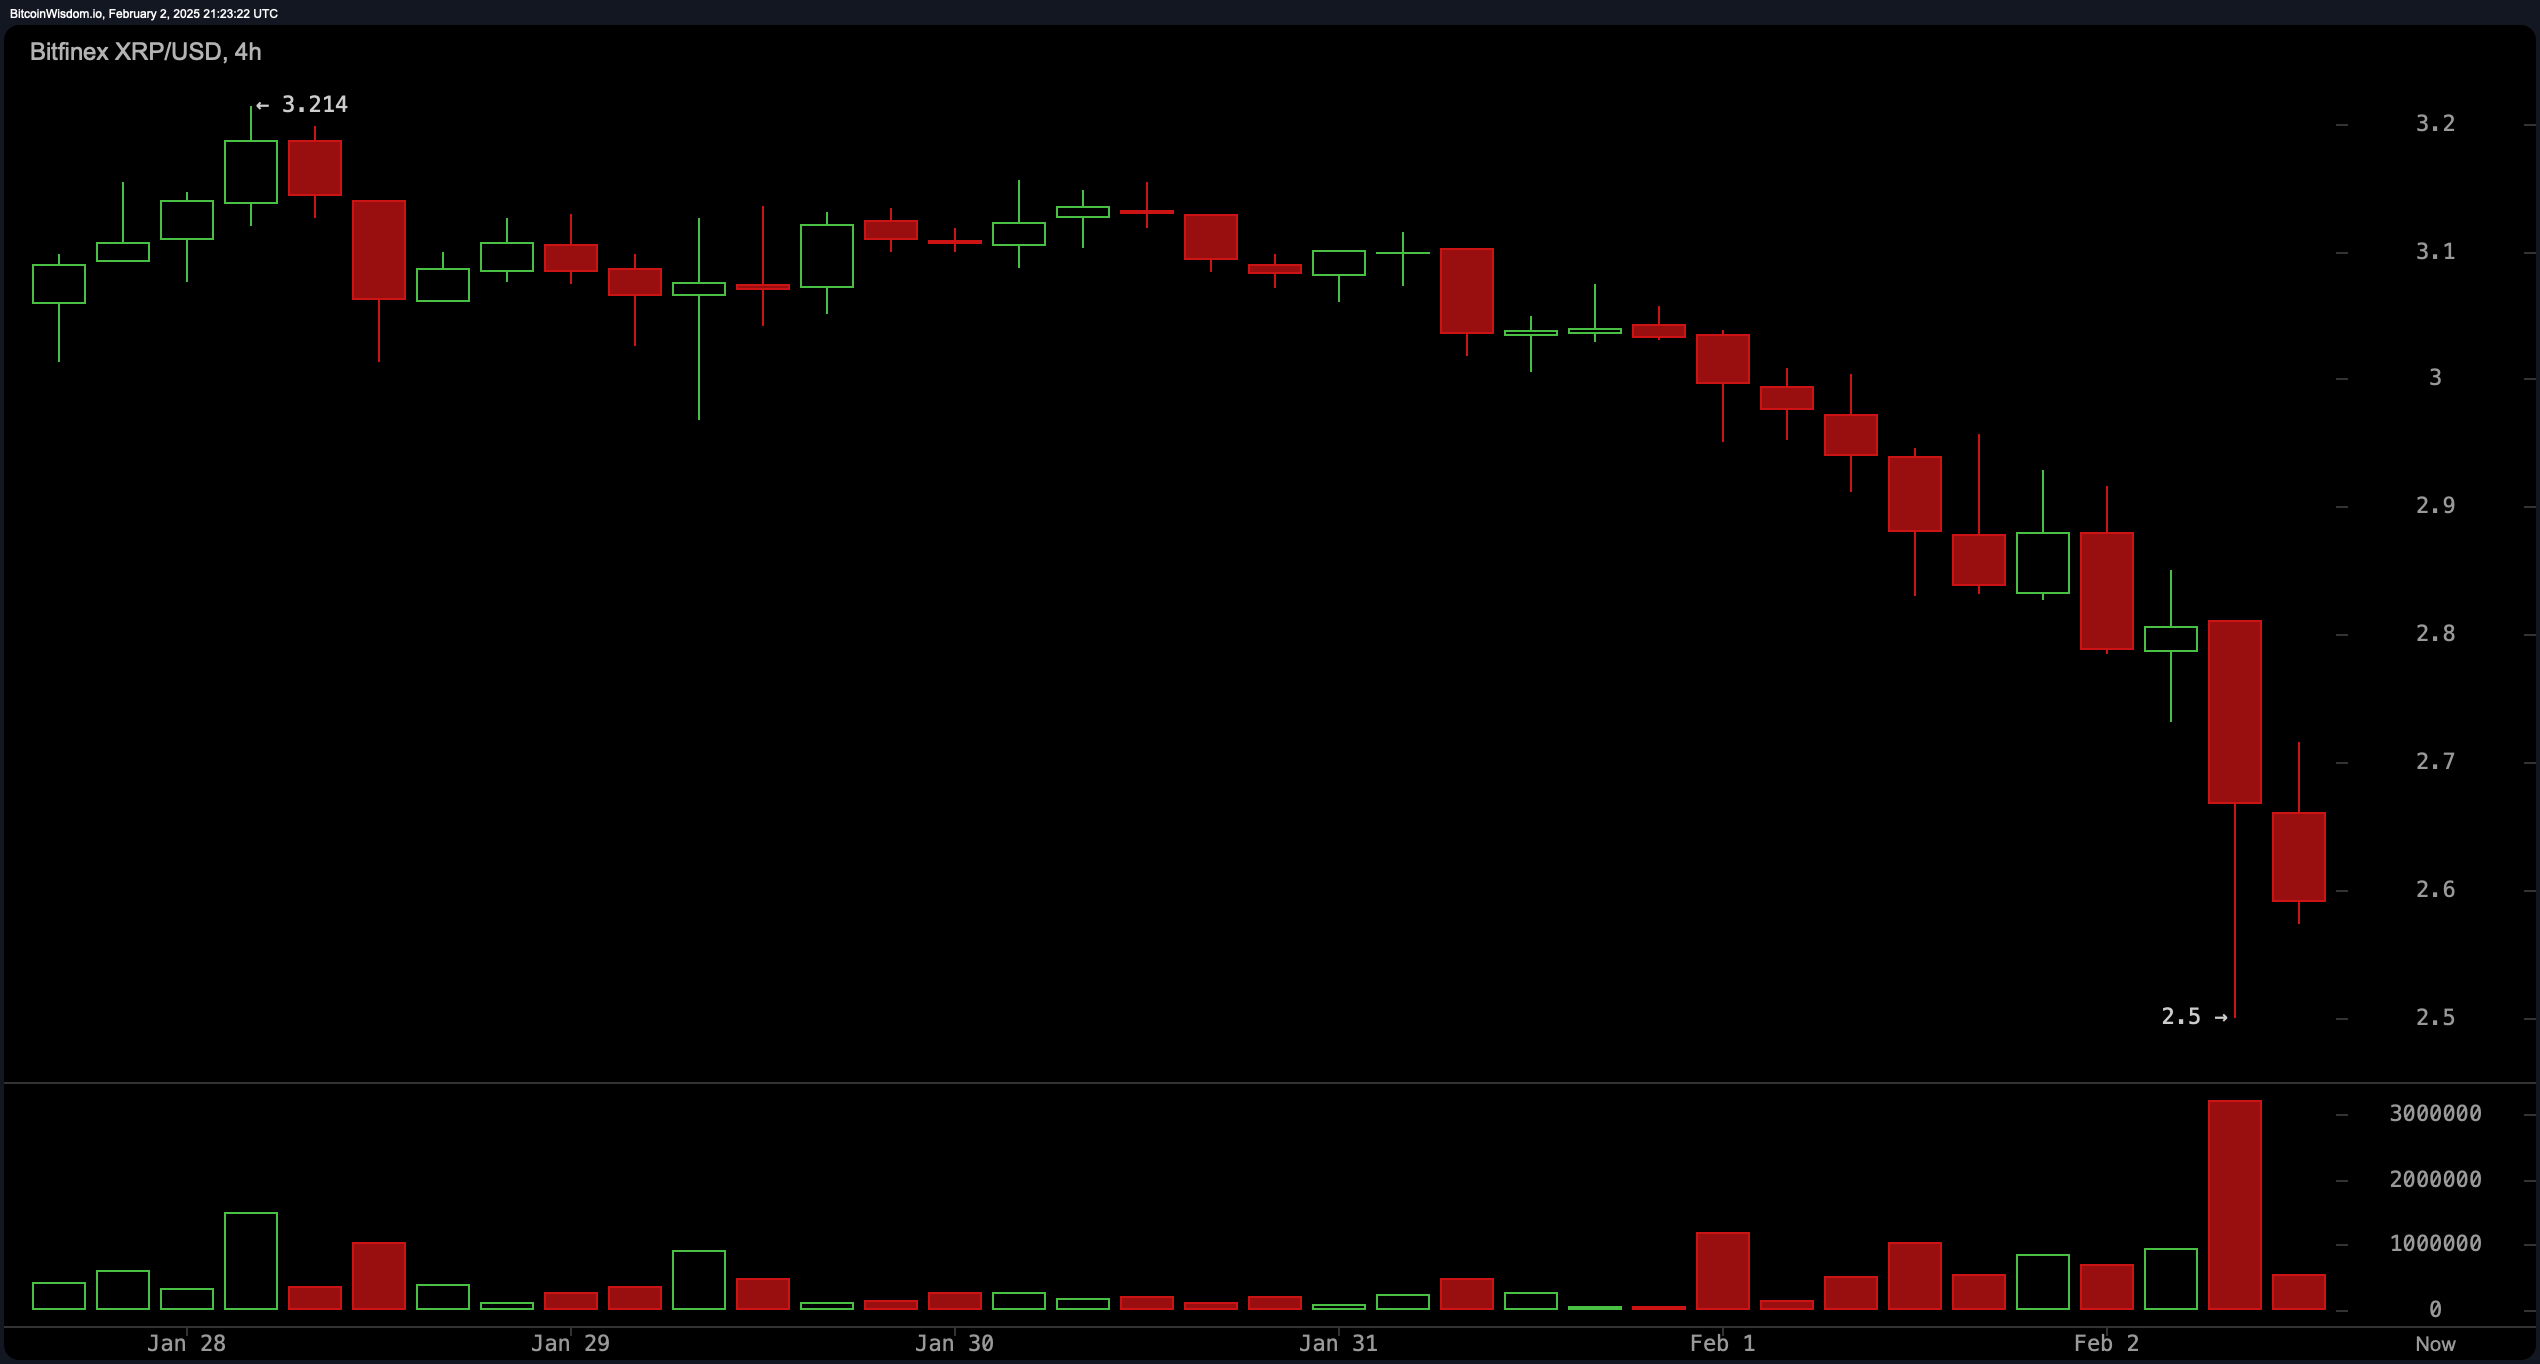
XRP/USD 4H chart via Bitfinex on Feb. 2, 2025.
Zooming out, the daily chart paints an extended bearish framework. XRP struggles to recapture prior peaks it once saw, stymied by the 50-day EMA and SMA, which now function as ceilings. These barriers bolster expectations of further depreciation, while the 100-day and 200-day averages offer distant cushions at $2.14 and $1.59, respectively. A breach beneath $2.50 might initiate a descent toward these levels. Conversely, a daily settlement above $2.75 could foreshadow a reversal, though confirmation demands consistent demand and an advance beyond the 50% Fibonacci marker at $2.91.
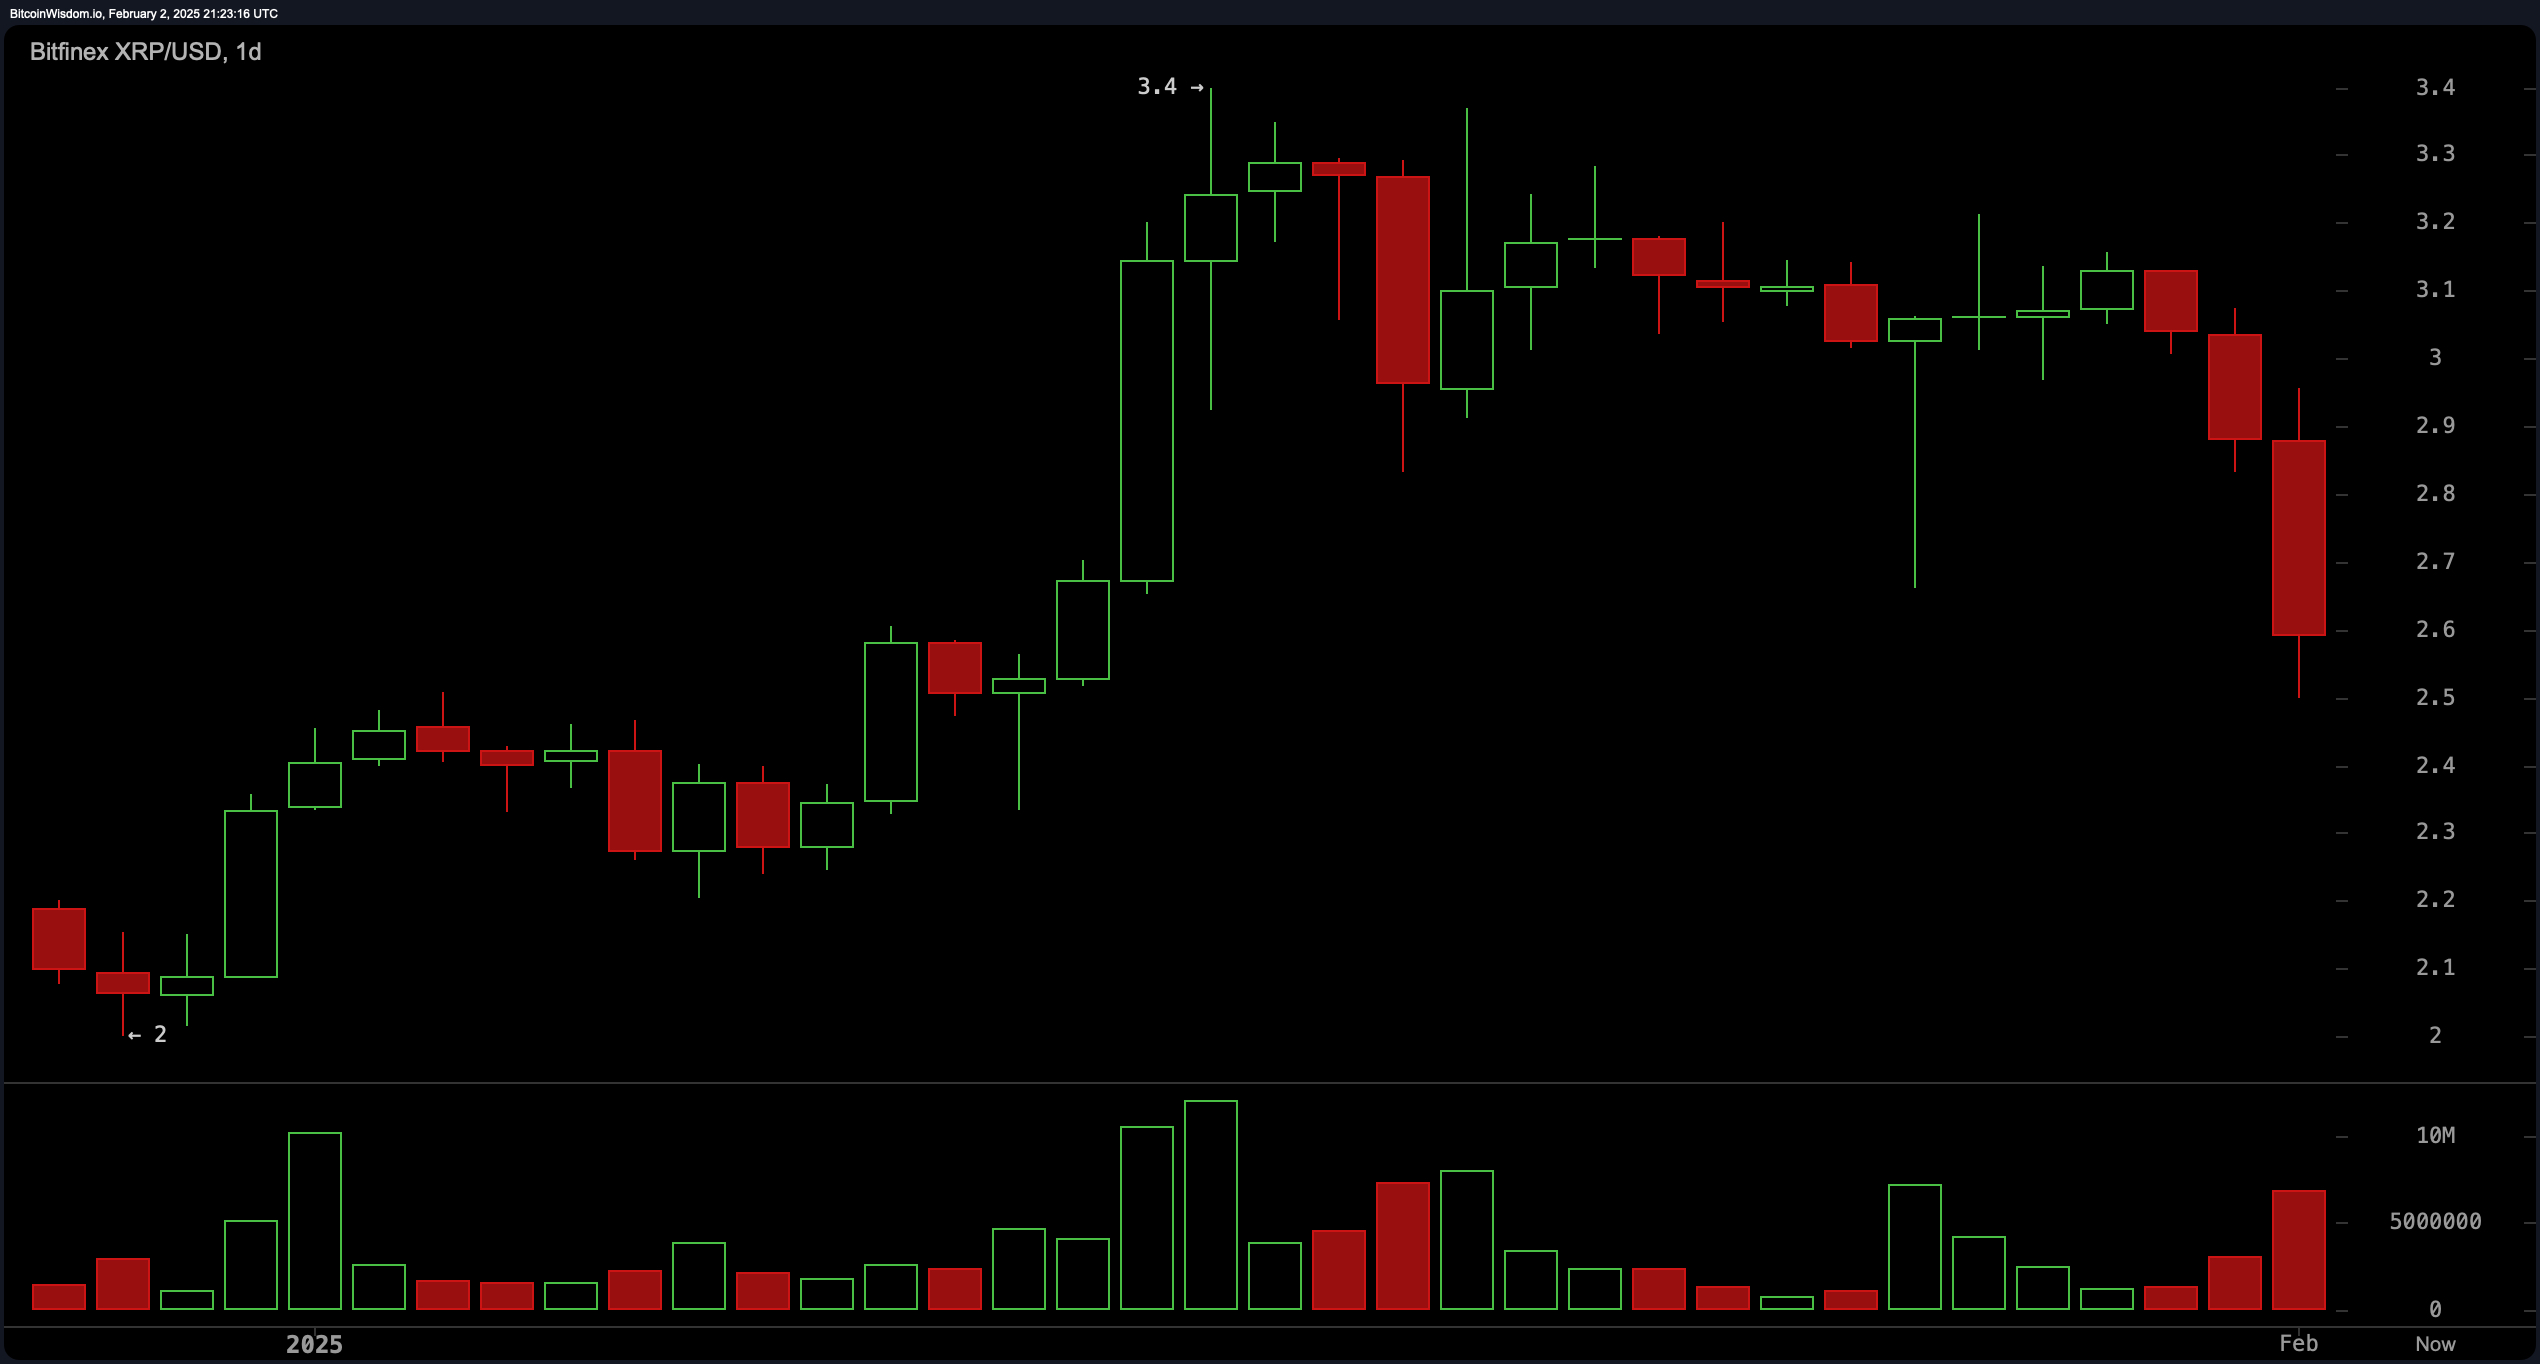
XRP/USD 1D chart via Bitfinex on Feb. 2, 2025.
Oscillators emit ambiguous signals: the RSI (38.83) hovers in neutral territory, approaching oversold thresholds, while the Stochastic (31.52) and commodity channel index (-215.76) reflect indecision. The average directional index (18.91) implies tepid trend potency. Though the awesome oscillator (0.208) hints at marginal upward impetus, the MACD (0.081) reinforces the dominant bearish inclination.
Moving averages (MAs) uniformly advocate for bearish positions, with the 10-, 20-, 30-, and 50-day EMAs and SMAs aligned downward. Only the 100- and 200-day averages flash buy signals, suggesting longer-term foundations retain stability. A sustained drop below $2.50 per XRP may test these deeper supports, while a clearance of critical resistance at $2.75 and $2.91 is essential for bullish momentum. Presently, the scales tip decisively toward caution, with downward risks eclipsing fragile optimism.
Bull Verdict:
While prevailing sentiment skews bearish, latent optimism flickers in XRP’s technical tapestry. A decisive close above $2.75—and subsequently the 50% Fibonacci level at $2.91—could ignite a reversal, buoyed by the Awesome Oscillator’s faint bullish whisper and the 100-/200-day moving averages’ steadfast support. Traders eyeing contrarian plays may find strategic entries if demand resurges to overpower supply.
Bear Verdict:
The symphony of technical evidence resounds with caution. Persistent failures to breach resistance, coupled with moving averages’ downward chorus and the MACD’s bearish refrain, tilt risk-reward decisively south. A breakdown below $2.50 risks unraveling toward $2.14 or lower, with oscillators’ neutral ambivalence offering little defense. Until buyers orchestrate a structural shift, prudence favors bearish alignment.


